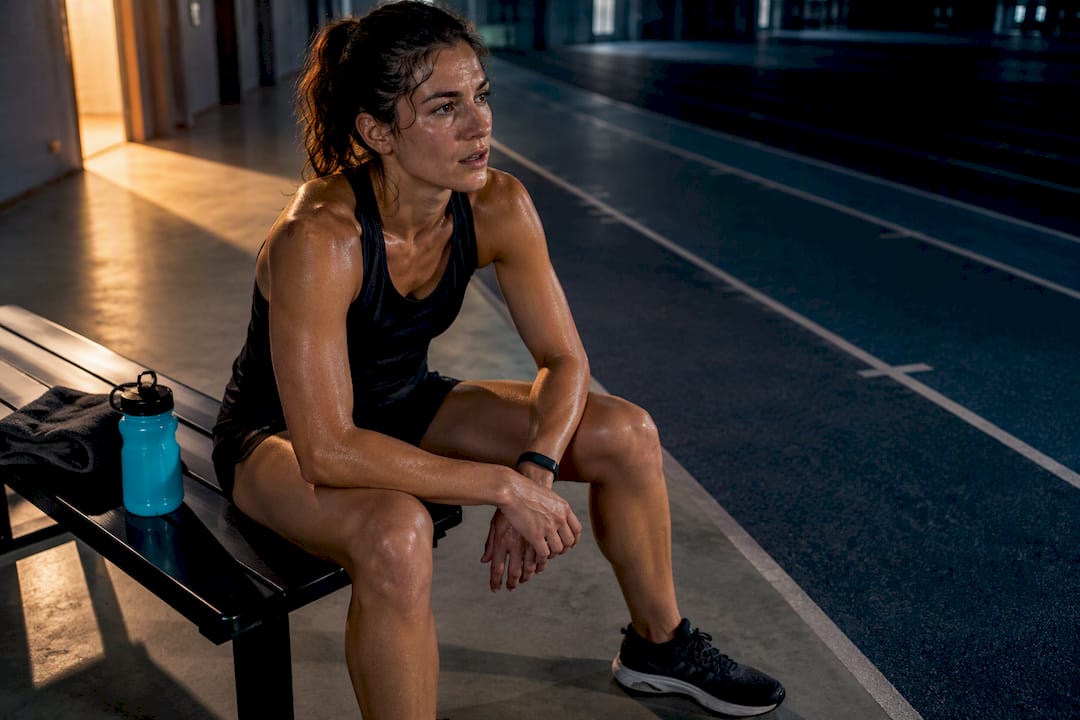
Wearables can flag the trend that precedes overtraining, but they cannot diagnose it. Heart rate variability, resting heart rate, and sleep data give you an early warning system when read as a 7‑day rolling average against your own baseline, not a single day’s reading. If your readiness metrics sag for more than a week alongside worse sleep and mood, cut intensity, protect sleep and food intake, and if the decline runs persistently beyond several weeks, get a clinical review.
TL;DR:
- Wearables can indicate early signs of overtraining through trends in heart rate variability, resting heart rate, and sleep, but cannot provide a diagnosis.
- A sustained decline in these metrics over three to four weeks, especially alongside mood changes or persistent performance drops, suggests overtraining syndrome.
- Tracking a 7-day rolling average of HRV and comparing it to your baseline is the most reliable way to detect meaningful fatigue signals.
- External factors like illness, travel, caffeine, or medications can affect metrics, so subjective feelings and other health issues must be considered.
- Most effective prevention involves limiting weekly training increases to 10 percent, maintaining load ratios between 0.8 to 1.3, and planning regular deload weeks.
Table of Contents
- What overtraining actually is (and why it’s a continuum, not a switch)
- Which wearable metrics actually tell you something useful
- How to turn wearable numbers into training decisions
- Where wearable data goes wrong
- Preventing overtraining: the load rules that actually work
- How Voltrahealth supports this kind of monitoring
- A realistic routine, and where the conventional wisdom oversells itself
- Track your recovery without a subscription eating into the savings
- Sources
- FAQ
What overtraining actually is (and why it’s a continuum, not a switch)
Overtraining isn’t a single event. It’s a slide, and most athletes cross the early stages without noticing.
Functional overreaching is deliberate and temporary. You push volume or intensity hard for a week or two, performance dips, and you bounce back stronger after a few days of easier training. This is how periodisation is supposed to work.
Non‑functional overreaching is the same dip without the bounce. Fatigue lingers for weeks rather than days, and normal recovery windows stop working.
Overtraining syndrome (OTS) is the clinical end of the spectrum: a performance decline that persists for more than three to four weeks, resistant to rest, and usually tangled up with mood disturbance, disrupted sleep, and a flat motivation to train at all. This is according to a review of overtraining and related conditions.
Wearable data can hint at where you sit on that continuum, but the diagnosis itself is clinical. Watch for these non‑wearable signs alongside your metrics:
- A performance drop that doesn’t respond to a normal easy week
- Mood swings, irritability, or a flat emotional register that wasn’t there before
- Getting ill more often, or minor infections that linger
- Losing the appetite to train, even for sessions you usually enjoy
Context matters as much as the symptoms themselves. Low energy availability, an underlying illness, anaemia, or a thyroid issue can all mimic overtraining almost exactly. A good coach or GP will rule those out before pinning the decline on training load alone.
Which wearable metrics actually tell you something useful
Not every number your device spits out deserves your attention. Four matter more than the rest, and each tells you something slightly different.

Heart rate variability (RMSSD) is the most useful single metric for tracking autonomic fatigue. RMSSD reflects parasympathetic nervous system activity, and it tends to fall when your body is under sustained strain it hasn’t adapted to. A systematic review on HRV as a marker for overtraining prevention found RMSSD and a related measure called DFA alpha‑1 to be the most sensitive markers currently in use, with HRV‑guided training producing measurable gains in VO2max and power output compared with fixed training plans.
Where you capture that reading matters. A quick morning “ultra‑short” recording, taken for a minute or two before you get out of bed, is convenient but noisier. A nocturnal average taken across sleep tends to smooth out the day’s stress and give you a cleaner signal.
Resting heart rate is the simplest metric on the list and still worth tracking daily. A resting heart rate sitting several beats above your normal for multiple mornings running is one of the oldest overtraining flags in sports science, and it costs you nothing extra to check.
Sleep duration and quality shape everything else. Poor sleep suppresses HRV recovery and inflates resting heart rate on its own, independent of training stress, so a bad night can muddy your other numbers.
Training load proxies, such as session RPE, power output, or pace at a given effort, complete the picture. These tell you what you’re actually asking your body to do, which matters when you’re trying to work out why your recovery metrics have shifted.
On hardware: chest‑strap devices measure a genuine electrical signal close to clinical ECG accuracy. Wrist‑worn optical (PPG) sensors are more convenient but more prone to motion artefact, particularly during exercise. Ring form factors often produce steadier nocturnal readings simply because fingers move less than wrists overnight.
How to turn wearable numbers into training decisions
Raw daily numbers are mostly noise. The skill is building a baseline that lets you spot a real signal inside that noise, then reacting proportionately.
- Collect consistently. Measure at the same time each day, in the same posture (lying or seated), with the same device settings. Consistency here matters more than the device you use.
- Build a 7‑day rolling average. A single morning’s HRV reading swings wildly with sleep position, hydration, and even room temperature. A 7‑day average filters that out and shows you the actual trend, a method backed by practical HRV research in strength and conditioning.
- Calculate your smallest worthwhile change (SWC). This is the threshold below which a shift in your average is just biological noise rather than a genuine signal. In practice, a change of roughly half a standard deviation of your own baseline readings is a reasonable working figure. Below that, ignore it. Above it, pay attention.
- Favour longer measurement windows over snapshots. A study on PPG wearable accuracy found that night‑level or 30‑minute averages, paired with stricter validity thresholds, produce far more reliable HRV data than isolated 5‑minute daytime readings, particularly on wrist‑based devices.
- Track your acute:chronic workload ratio (ACWR). This compares your last week’s training load against your rolling four‑week average. A conservative target zone of 0.8 to 1.3 keeps you out of the danger territory where injury and illness risk climb sharply.
- Cap your weekly progression at around 10%. Ramping volume or intensity faster than that is one of the most consistent predictors of breakdown across load‑management research.
Once you’ve got the baseline and the thresholds sorted, the decision rules are straightforward:
- A single bad day: monitor only. Don’t change your programme off one reading.
- A sustained drop beyond your SWC for 3 to 7 days, especially alongside poor sleep or unusual soreness: back off intensity or insert an active recovery day.
- A decline that persists beyond 3 to 4 weeks, regardless of what you try: stop guessing and get a clinical review.
Pro Tip: Pair your wearable trend with a short, repeatable performance check, such as a fixed submaximal effort or a familiar time trial. If your HRV is dropping but your submaximal heart rate and pace haven’t budged, you’re probably fine. If both are moving the wrong way together, take it seriously.
Where wearable data goes wrong
Every metric above is only as good as the measurement behind it, and wearables have real, well‑documented limits worth knowing before you trust a bad week of readings.
Accuracy varies significantly by form factor. Chest straps using electrical sensors sit close to clinical ECG accuracy. Wrist‑based optical sensors lose precision during movement, which is exactly when you might want the data most. Ring devices generally perform better overnight, when the body is still.
A review of commercial wearable biosensors found devices genuinely useful as training‑load adjuncts, but flagged that proprietary “readiness” scores often obscure the raw HRV signal behind an algorithm you cannot inspect. That is worth knowing before you treat a branded score as gospel.
Across validated wearable studies, HRV accuracy consistently improves once measurements move from short daytime snapshots to averaged windows of 30 minutes or more overnight, with stricter validity thresholds filtering out artefact‑corrupted readings.
Confounders are the other trap. Several things will move your numbers without a single extra training session:
- Illness, even a mild cold before symptoms fully appear
- Travel and time zone shifts
- Caffeine and alcohol, particularly the night before a morning reading
- Certain medications
- Menstrual cycle phase, which shifts HRV and resting heart rate predictably across the month
One analysis of HRV trends in athletes makes a genuinely counterintuitive point: some athletes show HRV increases during early non‑functional overreaching rather than the expected drop, which is exactly why a single metric read in isolation can mislead you. Cross‑reference with subjective markers such as mood, soreness, and perceived exertion. Practitioner guidance on HRV notes that subjective changes often show up before the objective numbers do, so don’t dismiss how you feel just because your dashboard still looks green.
Preventing overtraining: the load rules that actually work
Detection matters, but prevention is cheaper than recovery. Four rules do most of the work.
- Cap weekly load increases at roughly 10%. Load management guidance from the IOC consistently links sharp week‑to‑week jumps to higher illness and injury risk, and this single rule prevents more overtraining than any wearable ever will.
- Keep your ACWR inside 0.8 to 1.3. IOC consensus research on load and injury risk shows the risk of injury and illness climbs sharply once your acute load outpaces your chronic average beyond this window.
- Schedule deload weeks on purpose, not by accident. Build a lighter week every three to five weeks rather than waiting until your body forces one on you, and plan your heaviest blocks around your actual competition calendar rather than an arbitrary training cycle.
- Respond to poor trends by subtracting, not adding. When your rolling averages worsen, swap a high‑intensity session for an easy one or a full rest day, then double down on sleep, energy intake, and stress management rather than trying to train through it.
Rebuilding load too fast after time off is one of the most common ways athletes reinjure themselves or tip straight back into overreaching. If you’re managing a joint issue specifically, structured return‑to‑training approaches are worth reading alongside your load data.*
The referral point doesn’t move regardless of how disciplined your training is: a decline lasting beyond three to four weeks, or any red‑flag symptom such as persistent illness or a genuine loss of motivation to train, means it’s time to loop in a clinician rather than adjust the programme yet again.
How Voltrahealth supports this kind of monitoring
Tracking HRV, sleep, and daily activity consistently over months is where most people give up, usually because a subscription fee makes the app feel disposable the moment motivation dips. Certain health tracking devices can monitor HRV, resting heart rate, and sleep in real time without recurring charges to keep seeing that data.
That matters for the workflow described above. Building a genuine 7‑day rolling average and spotting a change beyond your smallest worthwhile change requires months of unbroken data, not a free trial that lapses into a paywall right when your training gets serious. Readers building a breathwork or recovery habit around HRV might also find Voltrahealth’s own guidance on improving HRV over 8 to 12 weeks or its resonance breathwork protocol useful alongside device data.
None of this replaces clinical judgement. A wearable, however good, tracks trends. It doesn’t diagnose overtraining syndrome, rule out anaemia, or read your mood for you.

A realistic routine, and where the conventional wisdom oversells itself
Most advice on wearables and overtraining either oversells the technology as diagnostic or dismisses it as gimmicky. Both miss the point. Treat it as a trend detector, nothing more, and it earns its place in your week.
Here’s the routine worth adopting: collect your morning or nightly readings the same way every day, compute a 7‑day rolling average rather than reacting to single numbers, apply your smallest worthwhile change threshold before you touch your programme, and act conservatively when it’s breached. That’s it. No dashboard replaces a conversation with a coach who watches you train, or a doctor who can run bloods if your numbers and your body both say something is wrong.
The technology is genuinely useful. It just isn’t the whole story, and treating it as one is where most athletes go wrong.
— Sam
Track your recovery without a subscription eating into the savings
Most wearables that promise HRV and sleep insight lock the useful data behind a monthly fee, which quietly defeats the point of long‑term monitoring. Some companies take the approach of selling a device once, with free access to the app and its tracked metrics without recurring charges to see recovery trends.
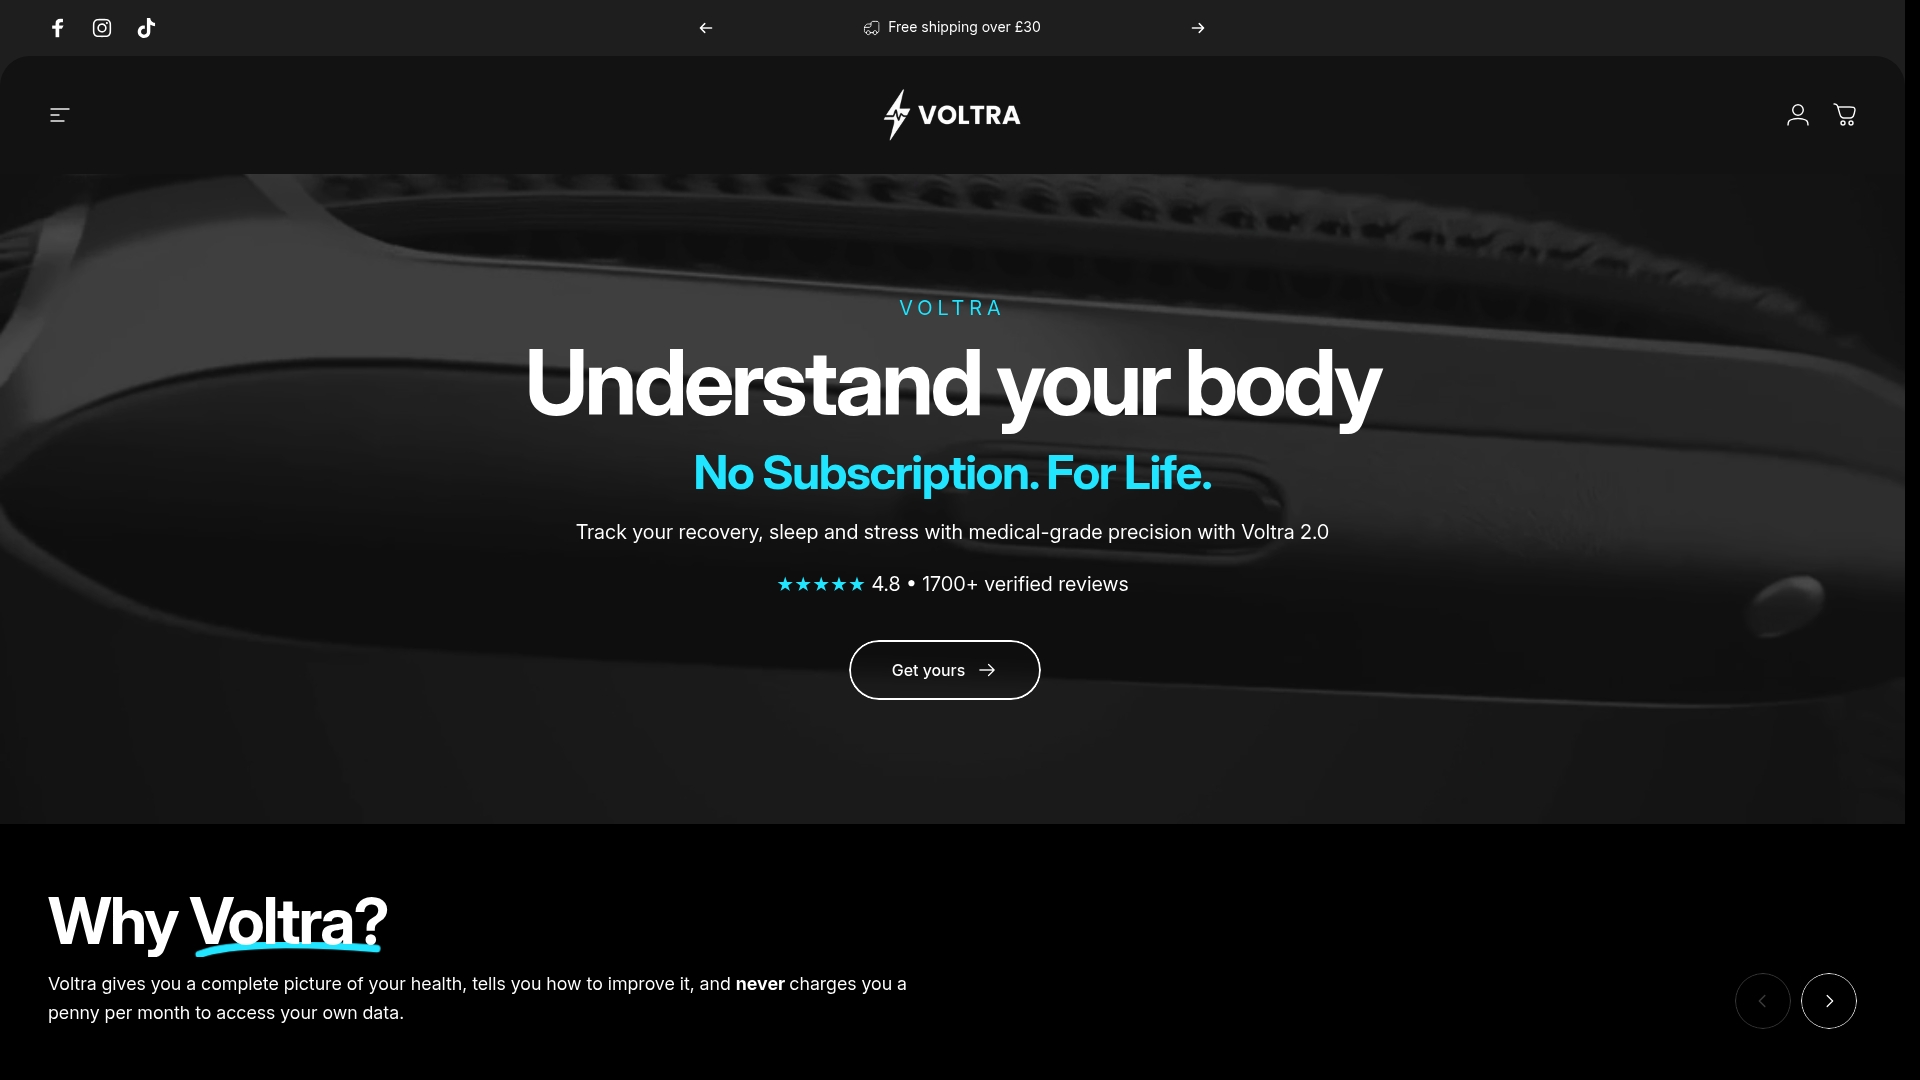
The VOLTRA AIR tracks HRV, resting heart rate, sleep, and daily activity in real time, giving you exactly the data this guide walks through, without a paywall interrupting the months of readings you need to build a reliable baseline. If you want deeper biometric detail alongside body composition tracking, the VOLTRA PRO and VOLTRA CORE collections go further still. Whichever line you pick, the device measures trends, not diagnoses, so pair it with the routine above and check in with a clinician when a decline runs past three or four weeks. Head to the VOLTRA AIR product page to see current pricing and get started.
Sources
The claims in this guide draw on peer‑reviewed research and consensus statements rather than marketing copy, and these are worth reading in full if you want to check the evidence yourself:
- Overtraining and related review (PMC)
- Accuracy of PPG wearables (Oura ring study) — PMC
- Load management guidance and IOC consensus
FAQ
What are four signs of overtraining?
The four most reliable signs are a performance decline that doesn’t recover with normal rest, disrupted sleep, mood changes such as irritability or flatness, and getting ill more often than usual. On a wearable, these often show up as a sustained drop in your HRV rolling average alongside a raised resting heart rate.
How do you know if you’ve overdone it?
A single hard session or bad night rarely means you’ve overdone it. Overreaching becomes a concern when your performance, sleep, and recovery metrics stay worse than your baseline for more than a week, and it becomes overtraining syndrome if that decline persists beyond three to four weeks despite rest.
What are the symptoms of Stage 1 overtraining syndrome?
Early‑stage overtraining, often called functional or non‑functional overreaching, typically involves a temporary performance plateau or dip, slightly disrupted sleep, and subtle mood changes such as irritability or reduced motivation. These symptoms should resolve within days to a couple of weeks with easier training; if they don’t, you’ve likely moved into more serious non‑functional overreaching.
Does HRV go down with overtraining?
Usually, yes. Falling RMSSD is one of the most consistent markers of accumulating fatigue in the research on HRV‑guided training. It isn’t universal, though. Some athletes show HRV rise during early non‑functional overreaching, which is exactly why HRV should be read alongside sleep, mood, and performance data rather than in isolation.
Can Voltrahealth devices detect overtraining on their own?
No single wearable, Voltrahealth included, can diagnose overtraining syndrome, because that’s a clinical assessment. Voltrahealth’s devices track HRV, resting heart rate, and sleep over time without a subscription fee, which makes them well suited to spotting the sustained trend changes worth discussing with a coach or doctor.
Share:
Two Hour Rule for HRV: How Caffeine Shifts Your Morning Baseline
How Wearable Tests Reveal Why 15 Minute HRV Spike After Cold Exposure Misleads