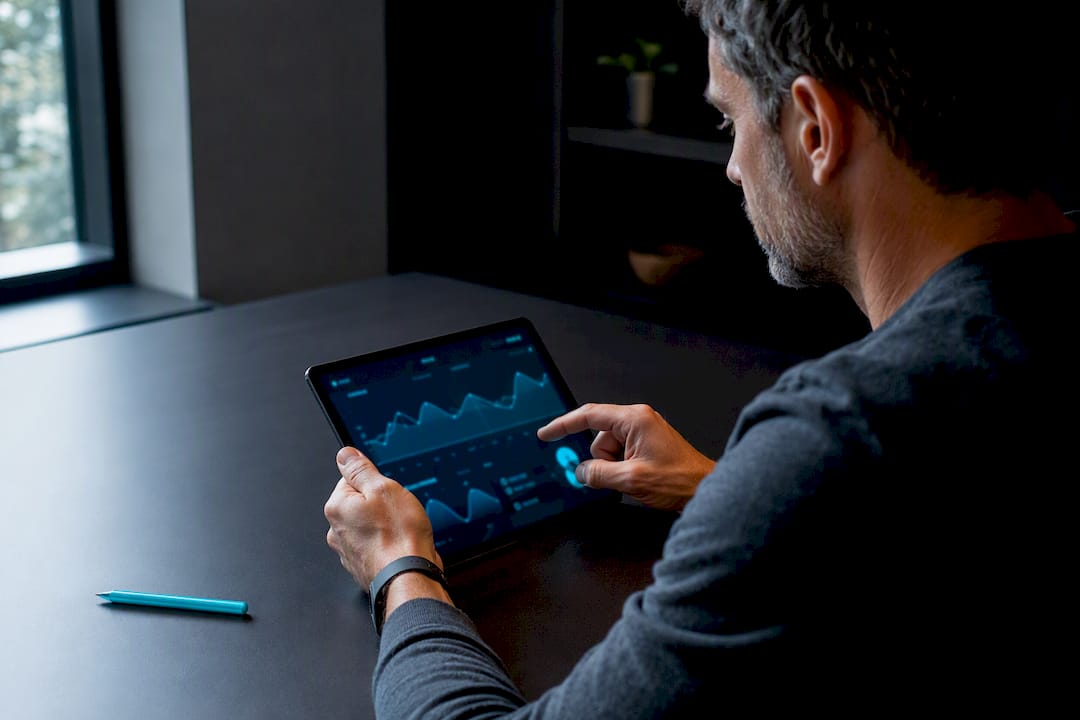
A readiness score is a daily composite of your sleep, resting heart rate, and heart rate variability that shows whether your body is recovered enough to train hard or needs rest. It draws on a personal baseline built from several nights of data, not a single fixed benchmark. When the number is low, favour recovery. When it is high, you can generally push training intensity with less risk.
TL;DR:
- Readiness scores depend on personal baselines built from multiple nights of data, making consistency in wearing devices essential for reliable results.
- Fluctuations in sleep quality, illness, alcohol consumption, or stress can cause small daily changes, but persistent declines over several days signal incomplete recovery.
- Improving sleep habits, managing stress, and maintaining a consistent training schedule can raise readiness scores more effectively than trying to game the system.
- Sensor accuracy varies: optical HRV measurement and sleep tracking are more reliable at rest and over multiple nights rather than from single-day readings.
- Long-term trend analysis outweighs single scores, and any unusual, persistent pattern warrants consultation with a healthcare professional rather than sole reliance on device data.
Table of Contents
- What readiness scores measure: the physiological inputs and personal baselines
- How a readiness score is calculated
- What the ranges mean: low, moderate and high readiness
- Interpreting day-to-day changes and what causes a low score
- Limitations: wearable accuracy for HRV and sleep
- How to improve your readiness score
- Voltra’s perspective on reading your recovery data well
- Tracking your readiness with a Voltra device
- Sources
- FAQ
What readiness scores measure: the physiological inputs and personal baselines
Most systems build a readiness score from three core signals: overnight heart rate variability (sometimes called pulse rate variability on optical sensors), resting heart rate, and recent sleep. Some platforms add extras such as skin temperature, previous-day movement or menstrual cycle context, which can shift baseline expectations across a cycle.
The score only means something once your device has learned what “normal” looks like for you. Google Health, for instance, states that its readiness score combines HRV, resting heart rate and recent sleep, and needs several nights of data before it produces a reliable first reading.
- HRV or PRV: measured overnight, reflecting autonomic nervous system recovery.
- Resting heart rate: usually the lowest or average value recorded during sleep.
- Sleep quantity and quality: total sleep time plus estimated sleep stages.
- Optional extras: temperature, movement load, cycle phase, depending on the platform.
Wearing your device consistently for seven to fourteen nights lets it establish both a short-term pattern and a longer rolling baseline. Vendors weight these inputs differently, so a score of 80 on one platform is not directly comparable with 80 on another.
How a readiness score is calculated
The general approach behind most readiness algorithms follows a similar shape, even though the exact formulas are proprietary and vary by brand.
- Each raw input (HRV, resting heart rate, sleep) is converted into a scaled sub-score, often against your own historical range rather than a population average.
- Short-term deviations, such as last night’s sleep or this morning’s HRV, are compared against a longer rolling baseline, commonly around fourteen days, to smooth out noise from one unusual night.
- The sub-scores are combined using set weights into a single figure, typically presented on a 0 to 100 scale, occasionally 0 to 10.
A modelling study that attempted to reconstruct a major platform’s readiness formula found sleep was the strongest single contributor, ahead of activity balance and resting heart rate, with sleep alone explaining a meaningful share of the variance in some cohorts. The same research described the score as roughly a weighted sum of sleep score, sleep balance, previous-day activity, activity balance, average resting heart rate and HRV balance, though the precise coefficients differ by vendor and are not published.
Pro Tip: Treat the published score as a rounded summary, not a lab result: the underlying maths is tuned per platform and rarely disclosed in full.
What the ranges mean: low, moderate and high readiness
Score bands vary slightly by platform, but the practical logic is consistent.
- Low readiness: your body is showing signs of incomplete recovery. Favour easy movement, extra sleep, or a full rest day rather than a hard session.
- Moderate readiness: you are broadly recovered but not primed for a peak effort. A normal training load usually suits this range.
- High readiness: HRV, resting heart rate and sleep all look favourable against your baseline, so harder intensity or volume carries less relative risk.
A single low morning is rarely worth acting on alone. What matters more is a downward trend across three or more consecutive days, since day-to-day variation of a few points is normal even in well-rested people. Because baselines are personal, a “70” that is unusually low for one person can be a perfectly ordinary reading for someone else.
Interpreting day-to-day changes and what causes a low score
Small daily fluctuations are expected: HRV and resting heart rate naturally shift with hydration, room temperature, and even how well the sensor sat against your skin overnight. A meaningful decline is one that persists across several nights rather than a single outlier reading.
Common non-training causes of a sudden drop include:
- Short or fragmented sleep, which reduces the sleep sub-score directly.
- Illness or an oncoming cold, which raises resting heart rate and suppresses HRV.
- Alcohol, which reliably elevates overnight resting heart rate and depresses HRV.
- Psychological stress, which shows up through the same autonomic pathways as physical fatigue.
- Device fit or firmware issues, which can distort the raw signal before any calculation happens.
A large meta-analysis of consumer sleep trackers found they overestimate total sleep time by an average of roughly 19.55 minutes compared with polysomnography, which means a “poor sleep” reading on your device may understate an already-short night rather than exaggerate it. Before adjusting your training plan around one bad score, check your sleep diary, rule out obvious illness symptoms, and confirm the device is snug and charged.
Limitations: wearable accuracy for HRV and sleep
Readiness scores are only as good as the sensors feeding them, and both HRV and sleep measurement have known constraints worth understanding before you treat the number as gospel.

Photoplethysmography-based HRV, the optical method most wrist wearables use, agrees reasonably well with ECG at rest but that agreement declines during movement, and pulse arrival time variability can cause the optical estimate to diverge from true ECG-derived HRV in some people. Consumer sleep trackers, meanwhile, estimate total sleep time reasonably well on average but misclassify individual sleep stages compared with lab-grade polysomnography, and the same review found they tend to underestimate wake after sleep onset. Our own look at fitness tracker accuracy covers how sleep-stage detection specifically holds up against clinical measurement.
Practical implications follow directly from this:
- Treat a single day’s reading as a rough estimate, not a diagnosis.
- Lean on multi-day trends, which smooth out individual sensor errors.
- Keep wear consistent, snug and charged, since a loose strap or low battery degrades the raw signal before any algorithm runs.
- Pair the score with how you actually feel, since subjective fatigue and objective data together give a fuller picture than either alone.
How to improve your readiness score
Improving readiness is mostly about improving the inputs it measures, not gaming the algorithm itself.
- Stabilise your sleep schedule. Consistent bed and wake times improve sleep quality more reliably than occasional long lie-ins; cutting evening alcohol also removes one of the most common causes of a depressed overnight HRV reading. Our guide on improving HRV covers a practical eight to twelve week approach.
- Periodise your training rather than reacting to single days. Scale intensity down after a genuinely low trend, but avoid rewriting your whole week around one noisy reading.
- Build a short daily breathing practice. Slow paced breathing, often cited around six breaths a minute, is a simple, low-cost way to support HRV over time, detailed further in our breathwork for HRV resource.
- Keep the device itself in good working order. Wear it snugly at night, charge it on a routine schedule rather than letting it run flat, and keep firmware updated, since sensor and processing improvements often ship through updates.
Pro Tip: Cutting resting heart rate by even a few beats per minute through consistent aerobic training and better sleep tends to move readiness more than any single supplement or gadget setting; see our notes on reducing resting heart rate for a practical starting point.
Voltra’s perspective on reading your recovery data well
Short-term readiness scores are noisy by nature. What tends to matter far more is whether your HRV, resting heart rate and sleep are trending in the right direction over weeks, not what one number says on a Tuesday. That is the case for lifetime, subscription-free data access: it removes any incentive to chase daily spikes just to justify a monthly fee, and lets you build the kind of long, unbroken trend line that actually reveals whether your training or sleep habits are working. If a pattern looks genuinely unusual and persistent, a clinician is the right next step, not another algorithm.
— Sam
Tracking your readiness with a Voltra device
Some health monitoring devices track core inputs like overnight HRV, resting heart rate and sleep, alongside body composition and activity, sometimes through an app with no recurring fees.
Expect the first seven to fourteen nights to be a baseline-building period, much like any wearable, so early scores will move around more than they will once your personal range is established. The VOLTRA AIR starts as a straightforward entry point for sleep and HRV tracking, the VOLTRA PRO adds a broader sensor set for closer training monitoring, and the VOLTRA CORE suits readers who also want detailed body composition data. Some devices offer lifetime access to historical data without subscription fees, which supports long-term health tracking. Browse the VOLTRA AIR, VOLTRA PRO and VOLTRA CORE collections to compare which sensor set fits your goals.
This article is general information, not a substitute for advice from a qualified doctor. Consult a qualified healthcare professional about your own circumstances before acting on anything here.
Sources
- Understanding your readiness score in the Google Health app - Google Health Help Center
- Evaluation of the accuracy of contactless consumer sleep-tracking devices: systematic review and meta-analysis - PMC
- Can wearable devices accurately measure heart rate variability? A systematic review - PubMed
FAQ
What is a good readiness score?
A good score depends on your own baseline rather than a fixed universal number, though most platforms treat the upper portion of their scale as a signal that HRV, resting heart rate and sleep all look favourable against your personal history. On a 0 to 100 scale, this generally sits in the high range, but a “good” reading for one person can differ meaningfully from another’s.
Why is my Fitbit readiness score always low?
A consistently low score usually points to a recurring issue rather than random noise: short or inconsistent sleep, regular evening alcohol, ongoing stress, or a device that fits loosely at night can all suppress the sleep, HRV and resting heart rate inputs the score depends on. Checking these factors before assuming the algorithm is wrong is the more useful first step.
How do I improve my readiness score on Oura?
Improving readiness on any platform, including Oura, comes down to improving the same underlying inputs: steadier sleep timing, less evening alcohol, regular light aerobic activity, and simple stress-reduction habits such as paced breathing. Oura’s own score also factors in previous-day movement and longer-term balance measures, so consistency over several weeks matters more than any single night.
How is your readiness score calculated?
Most systems convert your overnight HRV, resting heart rate and recent sleep into sub-scores measured against your personal baseline, then combine them with set weights into a single figure. The exact formulas are proprietary and differ by platform, though modelling research suggests sleep is typically the strongest single contributor.
Share:
Hydration percentage scale: how to buy and use one for reliable trend tracking
15–25% Error in Wearable Calories: 4 Rules for Health Conscious Users