
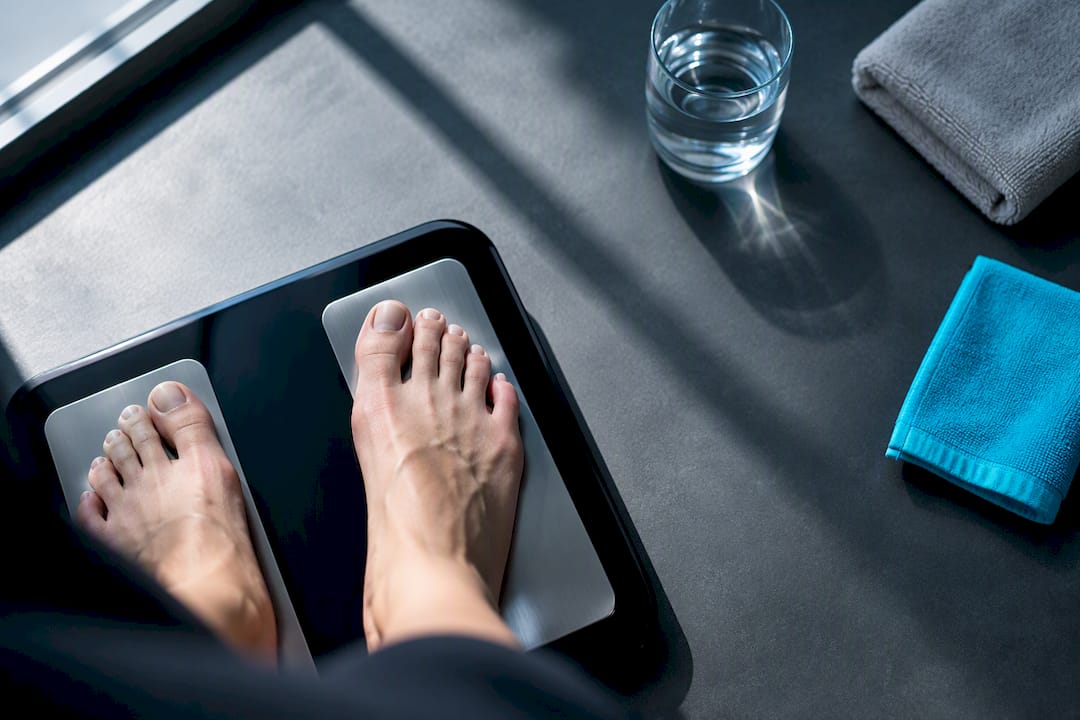
Yes, consumer smart body-composition scales estimate your hydration percentage using bioelectrical impedance, and they are best treated as trend tools rather than diagnostic devices. Single readings can shift for reasons that have nothing to do with your actual health, so the number that matters is the pattern over weeks, not any one morning’s figure. If you want that trend data without a subscription wall, Voltra’s scale range is a straightforward option to look at.
TL;DR:
- Hydration readings from consumer scales can fluctuate significantly due to recent water intake, exercise, or body position, making trend tracking essential.
- Using a standard measurement routine, such as weighing at the same time daily and on an empty bladder, improves the reliability of hydration trend data.
- Most scales use foot-only bioelectrical impedance at a single frequency, which samples only lower-body water and may underestimate total body water.
- Multi-frequency scales with hand and foot sensors offer more accurate separation of extracellular and intracellular water, but both methods are acceptable for trend monitoring at home.
- Voltra scales provide core hydration and body composition metrics with lifetime free trend access, offering better long-term value compared to models with subscription-based data.
Table of Contents
- How BIA-based smart scales estimate hydration percentage
- Accuracy limits and common sources of error
- How to use a hydration-percentage scale reliably
- Buying checklist: features that matter for hydration-percentage tracking
- App and data: turning numbers into useful insights
- What hydration percentage actually represents
- Comparing hydration percentage scales with other hydration tests
- Interpreting your hydration percentage reading
- Limitations specific to hydration percentage readings
- How age, sex, and body composition change your readings
- When a hydration percentage scale is worth the purchase
- Voltra’s scales for subscription-free hydration tracking
- Sources
- FAQ
How BIA-based smart scales estimate hydration percentage
Bioelectrical impedance analysis works by sending a low-level electrical current through your body and measuring the resistance and reactance it meets along the way. Water and dissolved electrolytes conduct electricity well, so tissue with more fluid produces less resistance, and the scale converts that resistance reading into an estimate of total body water using a built-in equation, as BIA research describes.
Most bathroom scales use a single frequency, typically 50kHz, sent through metal footpads. That current travels up one leg and down the other without ever crossing your torso, so the device is really only sampling your lower body and extrapolating a whole-body figure from it. Clinical multi-frequency or bioimpedance spectroscopy (BIS) systems send current across a much wider range of frequencies, which lets them separate extracellular water from intracellular water rather than just estimating total body water as one blended number, according to a review of BIA instruments.
That extra granularity is why hospitals and research labs use multi-frequency or BIS units rather than the single-frequency devices found in most homes. Some higher-end consumer scales now use octopolar electrode layouts, with handgrips as well as footpads, which reduces the amount of extrapolation needed and tends to produce steadier readings than foot-only designs.
Accuracy limits and common sources of error
A single hydration percentage reading is sensitive to far more than your actual fluid status. Recent drinking, exercise, the time of day, how you’re standing, skin temperature, alcohol, and salt intake can all push the number up or down within hours.
The effect can be substantial. One study on altered hydration status found that foot-to-foot BIA measurements changed markedly after participants drank 2,000mL of water, with the device notably underestimating total body water relative to baseline and overestimating body fat at the same time. That is a big swing from something as ordinary as a large glass of water before stepping on the scale.
Clinical reviews consistently point to the same fix: standardise the conditions under which you measure. Studies commonly ask participants to fast for four to six hours, avoid intense exercise for twelve hours beforehand, and empty their bladder first, precisely because those factors are the biggest sources of noise in BIA readings, per the instrument review. Populations such as older adults and athletes add further complexity, since diagnostic accuracy for detecting dehydration varies by the total body water threshold used and by individual body composition, as a systematic review on older adults notes.
The practical takeaway is to stop reading meaning into any single day’s percentage. A moving average across a week smooths out the noise from any one measurement and gives you a far more honest picture of whether your hydration is genuinely trending up or down.
How to use a hydration-percentage scale reliably
Getting a useful number out of a bathroom BIA scale is less about the hardware and more about your routine. A research-backed seven-step protocol built around the same confounders that clinical studies flag can turn a noisy daily reading into a trend you can actually trust.
- Weigh at the same time each day, ideally first thing in the morning, since fluid shifts throughout the day otherwise mask real change.
- Empty your bladder beforehand, because retained urine adds mass and alters the impedance path.
- Avoid large meals or drinks in the hour before weighing, since recent intake is one of the strongest short-term distorters of BIA readings.
- Skip intense exercise in the twelve hours prior, as sweat loss and blood flow changes shift readings independently of your baseline hydration.
- Stand barefoot on dry, clean feet, since damp or dirty skin changes contact resistance at the footpads.
- Keep clothing and posture consistent, standing still and evenly balanced rather than shifting weight between feet.
- Sync the reading to your app immediately, so the data lands in your trend history rather than getting lost or logged out of sequence.
Each step targets a specific confounder identified in the BIA literature: fluid intake, bladder volume, recent exertion, and skin contact all move the needle more than genuine day-to-day hydration change.
Pro Tip: If you’re travelling or working night shifts, pick a fixed point in your routine instead of a fixed clock time, such as immediately after waking, so the measurement stays comparable even when your schedule doesn’t.
Weigh daily using the protocol above, then look at your app’s seven-day average rather than yesterday’s number. Over a month, watch whether that weekly average is climbing, falling, or holding steady rather than reacting to any single spike.
Buying checklist: features that matter for hydration-percentage tracking
Not every smart scale gives you equally useful hydration data. A few hardware and software choices make a bigger difference than the marketing copy suggests.
- Electrode configuration: octopolar designs with handgrips sample more of the body than foot-only pads and reduce extrapolation error, per research on MFBIA performance.
- Frequency type: multi-frequency devices separate intracellular and extracellular water more reliably than single-frequency models, though both are acceptable for home trend monitoring.
- Trend visualisation: an app that graphs your history clearly matters more than an extra metric buried in a one-off screen.
- Platform integration: check for Apple Health or Google Fit syncing and export options if you want your data portable.
- Multi-user recognition: useful if more than one person in the household will use the same scale.
- Free access to core metrics: some brands lock hydration and body composition data behind a paywall after purchase.
On price, UK shoppers can expect consumer smart scales that report hydration percentage to sit in a roughly £70 to £130 range, with core metrics commonly available without a mandatory subscription, though some brands charge extra for premium tiers. Check the specific retailer for current availability in your market before buying.
App and data: turning numbers into useful insights
The scale itself matters less than the software behind it. A device that shows one number on a small screen is far less useful than an app that plots your hydration percentage against a moving average and lets you scroll back through months of history.
When comparing apps, check three things: whether the trend graph is clear and easy to read, whether you can export your data or sync it to Apple Health or Google Fit, and whether basic metrics like hydration and body fat sit behind a paywall after you’ve already paid for the hardware. Premium features such as detailed nutrition coaching or advanced recovery scoring can be genuinely useful, but they’re add-ons, not requirements for the core job of watching your hydration trend over time. A simple, reliable app with good history views will do more for long-term habit tracking than a device with an extra sensor and a confusing interface.
What hydration percentage actually represents
Hydration percentage, as reported by a smart scale, is an estimate of total body water expressed as a proportion of your total body weight. Water makes up a large share of lean tissue, since muscle holds considerably more fluid than fat does, which is why hydration percentage and body fat percentage tend to move in opposite directions on the same device.
Physiologically, this number is a proxy for how well your body is managing fluid balance across two main compartments: water inside your cells (intracellular) and water in the spaces and bloodstream outside them (extracellular). Clinical multi-frequency devices can separate the two, while single-frequency consumer scales report a single blended figure, according to the BIA instrument review.
That blended figure still has value. Fluid balance affects blood volume, temperature regulation, and how your muscles and joints feel during exercise, so a hydration percentage that’s trending downward over several weeks can be a useful early flag, even though the scale is not measuring cellular fluid balance directly. Treat the number as a general indicator of whether your fluid intake habits are keeping pace with what your body is losing, not as a precise physiological readout.
Comparing hydration percentage scales with other hydration tests
Bathroom BIA scales are not the only way to check hydration, and it helps to know where they sit relative to the alternatives. Urine colour and specific gravity tests are cheap, immediate, and reasonably good at flagging acute dehydration, but they say nothing about your longer-term body composition and are affected by things like vitamin supplements changing urine colour.
Blood osmolality testing, done in a clinical setting, is a more direct measure of fluid balance at the cellular level and is what clinicians actually rely on when dehydration is suspected as a medical concern. It requires a blood draw and lab analysis, so it isn’t something you’d do at home or repeat daily.
Deuterium oxide (D2O) dilution is the gold standard for measuring total body water in research settings, and it’s what validation studies use to check how accurate BIA devices really are. A 2023 validation study comparing bioimpedance spectroscopy against D2O found BIS performed well against the reference method, while single-frequency BIA differed more, though still within acceptable bounds for general monitoring.
The practical difference is convenience versus precision. A bathroom scale gives you a daily, free, at-home number you can track over months. A blood test gives you a precise clinical snapshot at one point in time. Neither replaces the other, and a smart scale’s real strength is the ability to repeat the measurement often enough to see a pattern that a one-off clinical test never could.
Interpreting your hydration percentage reading
There’s no single universal number that marks the line between well-hydrated and dehydrated, since healthy hydration percentage varies by body composition, sex and measurement method. What research does offer is a rough set of reference bands used in clinical studies to classify total body water status.
One systematic review of BIA in older adults cites thresholds where total body water at or below a lower threshold is treated as indicating dehydration, a mid-range as normal hydration, and above that suggesting overhydration, though the review also notes that diagnostic accuracy at these cut-offs varies depending on which threshold is applied and the population being studied.
Those bands were developed for clinical assessment, not for interpreting a home bathroom scale reading in isolation, so treat them as context rather than a personal target. What matters more for everyday use is the direction of your own trend line. If your seven-day average hydration percentage has drifted down over several weeks without a change in body composition, that’s worth paying attention to. A single day’s reading that looks low after a heavy workout or a salty meal usually isn’t telling you anything beyond what you already know happened that day.
Limitations specific to hydration percentage readings
Total body water and the hydration percentage your scale displays are related but not identical, and the gap between them is where most confusion happens. Total body water is the raw estimate of fluid the device calculates from impedance. Hydration percentage is that figure expressed as a proportion of your total weight, which means it’s also sensitive to any error in your weight measurement and your body composition estimate, not just to fluid status.
This compounding effect matters. If a scale slightly misjudges your body fat percentage, because foot-to-foot devices extrapolate from lower-body readings using population equations, that error can carry through into the hydration percentage figure too, as the instrument accuracy review explains. Someone with an atypical build, such as a very muscular frame or an unusually high or low body fat percentage, is more likely to see a hydration percentage that reads off from what a clinical multi-frequency device would report.
There’s also a timing mismatch worth knowing about. Hydration percentage reflects your fluid state at the exact moment of measurement, but body fat and muscle mass change far more slowly. That means a single hydration reading can look volatile day to day even while your actual body composition stays stable, which is exactly why the number needs to be read as a trend rather than a fixed trait like height. The fix isn’t a different formula, it’s the same discipline covered earlier: consistent conditions and a moving average rather than a snapshot.

How age, sex, and body composition change your readings
Hydration percentage is not a flat number that applies the same way to everyone, because the tissue composition it’s built on differs by age, sex, and muscle mass. Muscle holds substantially more water than fat tissue does, so someone with a higher muscle-to-fat ratio will typically show a higher hydration percentage on a BIA scale than someone at the same weight with a higher fat percentage, independent of how much they’ve actually had to drink.
Sex differences follow from the same logic. Men tend to carry more muscle mass on average than women at a comparable weight, which is one reason hydration percentage readings often differ by sex even among people with similar fluid intake habits.
Age adds another layer. Body composition shifts over the years, typically with declining muscle mass and changing fluid distribution, and a systematic review focused on older adults found that BIA’s ability to detect genuine dehydration in this group depends heavily on which total body water threshold is used, reflecting the fact that older bodies don’t fit the same reference ranges as younger ones. Athletes present a related challenge in the opposite direction, since higher-than-average muscle mass can push hydration percentage readings up in a way that reflects body composition rather than fluid status.
None of this means the number is meaningless. It means your own personal baseline matters more than any generic range, and the most useful comparison is always your reading against your own trend history rather than against someone else’s.

When a hydration percentage scale is worth the purchase
A hydration percentage scale earns its place for people who exercise regularly, care about recovery, or simply want honest feedback on whether their drinking habits are keeping pace with their activity. It’s less useful, and arguably the wrong tool, for anyone with a suspected clinical dehydration issue, which needs a proper assessment rather than a bathroom reading.
The value isn’t in any single number. It’s in the discipline of measuring the same way, at the same time, and trusting the trend line over the daily noise. Buying a device that gives you that history without ongoing charges makes the habit easier to keep up for years rather than months.
— Sam
Voltra’s scales for subscription-free hydration tracking
If the checklist above is what you’re shopping against, Voltra’s scale range is built around exactly those priorities. Each device reports hydration percentage alongside body fat, muscle mass, and bone mass, and every core metric stays available in the free companion app for the lifetime of the device, with no recurring fee to see your trend history or export your data.
- VOLTRA AIR covers the core body composition metrics, including hydration percentage, at £99.99 one-off with no subscription required.
- VOLTRA PRO adds more advanced tracking for £129.99 one-off, suited to anyone who wants deeper detail on top of the basics.
- VOLTRA CORE sits at £149.99 one-off for shoppers who want the fullest metric set in the range.
Where many competing scales hold trend history or raw metrics behind a monthly plan, Voltra keeps that data free for as long as you own the device, which matters most for a tool you’re meant to use for years, not weeks. Visit the VOLTRA AIR collection to compare the range and find the model that fits your routine.
Sources
For deeper reading, the BIA hydration study, the BIA instrument review, and NICE’s bioimpedance device guidance cover the clinical evidence in more detail. For everyday nutrition tips that support hydration habits, see this wellness article on beating cravings.
- Evaluating of altered hydration status on effectiveness of body composition analysis using bioelectric impedance analysis
- Independent review of best bathroom scales (UK)
- Validation of bioimpedance devices for TBW estimation versus D2O
FAQ
Do smart scales accurately measure hydration percentage?
Consumer smart scales estimate hydration percentage using bioelectrical impedance, which is reasonably useful for tracking trends but not precise enough for clinical diagnosis. A study on altered hydration status found readings shifted markedly after water intake, so single-day figures should be treated cautiously.
What is a normal hydration percentage on a body scale?
There is no single universal figure, since it depends on body composition, sex, and the device used. Clinical research cited in a systematic review uses reference bands around 73 to 74% total body water as a normal range, though these were developed for clinical assessment rather than casual home use.
Why does my hydration percentage change every day?
Daily swings usually come from recent drinking, exercise, time of day, or even how you’re standing on the scale, not genuine changes in your fluid status. Following a consistent measurement protocol and reading your weekly average instead of a single day’s number smooths out most of this noise.
Are multi-frequency scales more accurate than single-frequency ones?
Multi-frequency and bioimpedance spectroscopy devices generally provide more detailed fluid data than single-frequency consumer scales, since they can separate intracellular from extracellular water. A validation study comparing bioimpedance spectroscopy against a deuterium-oxide reference found BIS performed well against the reference method, while single-frequency BIA differed more, though still within acceptable bounds for general monitoring.
Share:
7 Step Protocol to Improve Bone Mass Scale Accuracy at Home
Wearable Users: Why Readiness Scores Mislead and How Long Term Data Helps