
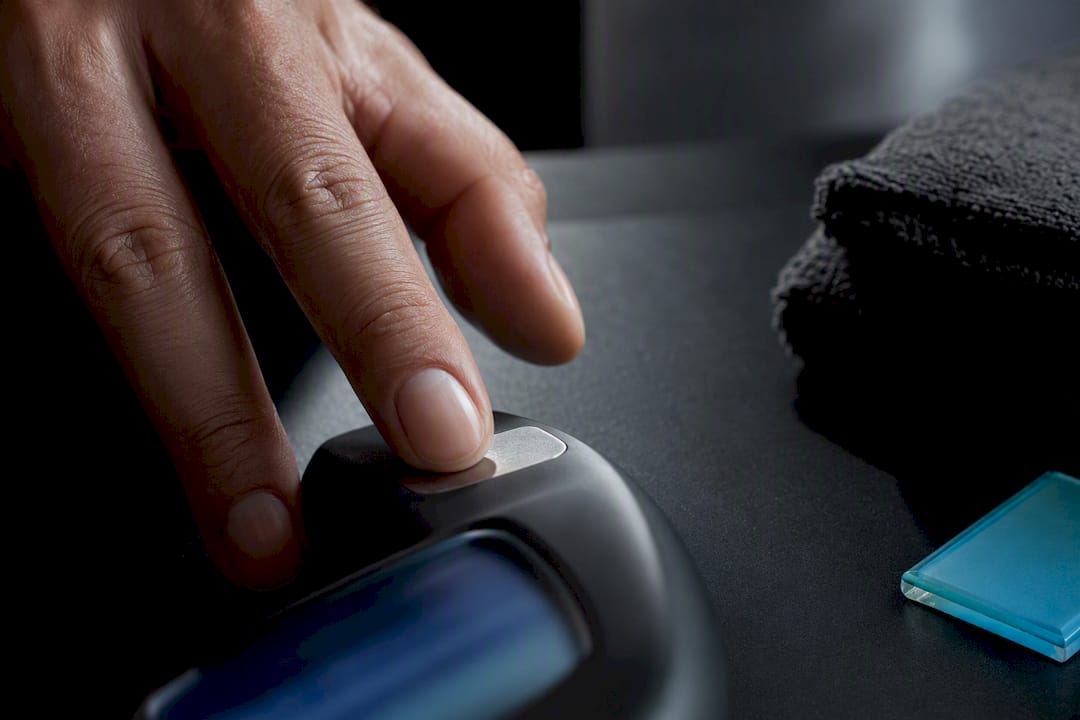
Consumer smart scales measure body weight accurately, usually within a few hundred grams, but they routinely misjudge absolute body fat percentage, sometimes by several kilograms of fat mass against a DEXA scan. Use a home scale to track direction and trend over weeks and months. Reach for a professional test, DEXA or a Bod Pod, only when you need a precise, one-off number for medical or research reasons.
TL;DR:
- Consumer smart scales reliably track weight with a median error of less than one kilogram but tend to underestimate body fat mass by about 2 to 4 kilograms compared to DEXA scans.
- Bioelectrical impedance analysis used in these scales is highly affected by hydration, recent food intake, skin temperature, and demographic input, which can cause significant measurement variability.
- Clinical methods like DEXA, Bod Pod, or hydrostatic weighing are more accurate for precise body composition analysis, especially for medical or athletic purposes.
- Consistent at-home tracking of weight and waist circumference over several weeks provides more actionable health insights than obsessing over single body fat percentage readings.
- Combining device data with context from sleep, activity, and recovery tracking improves understanding of body composition trends and health risks.
Table of Contents
- How bioelectrical impedance scales estimate body composition
- What the accuracy evidence actually says
- DEXA, Bod Pod, callipers or BIA: which method actually fits your need
- What throws off your body fat reading (and why)
- Getting useful trend data from a home scale
- When home tracking isn’t enough
- Why context matters as much as the number itself
- Chase the trend, not the decimal point
- How Voltra fits alongside your body fat tracking
- Sources
How bioelectrical impedance scales estimate body composition
Every consumer body fat scale, whether it is a stand-on bathroom model or a handheld unit, uses bioelectrical impedance analysis (BIA). A small, imperceptible electrical current runs through your body, and the scale measures how much resistance, or impedance, that current meets on the way through.
Fat tissue resists electrical current far more than lean tissue does, because muscle holds far more water and water conducts electricity well. Bone and fat, by contrast, are poor conductors. The scale converts that resistance reading into an estimated percentage of body fat using a mathematical formula, not a direct measurement. This is the detail most buyers never learn, and it explains most of the accuracy complaints you will read about smart scales.
Not all BIA devices work the same way. The current’s path through your body matters enormously:
- Stand-on, single-frequency scales send current from foot to foot, so the reading is dominated by your legs and largely blind to your upper body composition.
- Hand-to-foot and segmental multi-frequency systems route current across the torso as well as the legs, which tends to produce a more representative full-body reading. Segmental designs that add hand electrodes generally reduce the error introduced by leg-only measurement, though proprietary correction algorithms still leave device-specific quirks.
- Multi-frequency (MFBIA) systems send several current frequencies through the body, which lets them estimate intracellular versus extracellular water and, in theory, produce better regional detail than a basic single-frequency scale.
The final number you see on the screen also depends heavily on what you told the app about yourself. Age, sex, height, and sometimes an “athlete” or “fitness level” toggle all feed into a proprietary equation that converts raw impedance into a body fat estimate. Two people with genuinely identical impedance readings can get different body fat percentages purely because they entered different demographic details, and no manufacturer publishes the exact formula behind that conversion.
What the accuracy evidence actually says
The honest answer is: better than you might fear on weight, worse than most people assume on body fat percentage. A cross-sectional study published in JMIR mHealth tested three commercially available smart scales against DEXA scanning, the imaging method researchers treat as a reference standard for body composition. Weight readings were excellent, with a median difference of under one kilogram. Fat mass was a different story.
By the numbers: median absolute fat-mass errors of −2.2 kg, −4.4 kg, and −3.7 kg were recorded across the three tested smart scales when compared against DEXA, with most devices systematically underestimating fat mass rather than scattering errors randomly in both directions.
That systematic underestimation is the pattern to remember. It is not that smart scales are noisy and unpredictable; it is that most of them consistently read a bit low on fat mass, which means the error is at least somewhat correctable if you know it is there, but genuinely misleading if you take the number at face value.
Two other bodies of evidence back this up from different angles:
- A larger MFBIA validation study found high test-retest reliability (consistency ratings above 0.98) alongside a systematic negative bias against DXA, underestimating body fat percentage by roughly 4.2 percentage points in men and 2.8 points in women, with especially wide error margins for visceral fat specifically.
- Independent lab testing by Consumer Reports found that while some scales tracked weight well, none matched Bod Pod readings for body fat percentage, with errors as large as 21 to 34% relative to the lab measurement, and repeatability on the same device tended to be better than accuracy against the lab standard.
Two statistical terms are worth understanding here, because they explain why a scale can be “good” and “wrong” at the same time. Bias is the average direction and size of the error, a scale that is biased low will consistently undercount fat regardless of who steps on it. Limits of agreement describe the range within which an individual reading might fall relative to the true value, even after accounting for average bias. A device can have a small average bias across a study population and still be wildly off for any one person on any one day, which is precisely what the PMC-hosted report on smart scale accuracy found when it noted that individual errors varied with a person’s weight and BMI rather than staying constant.
DEXA, Bod Pod, callipers or BIA: which method actually fits your need
No single body composition method is right for everyone, and the “best” one depends entirely on what decision you are trying to make with the number.
DEXA (dual-energy X-ray absorptiometry) is the closest thing to a gold standard readily available to consumers, and it is what most of the validation studies above use as their reference point. It measures fat, lean mass, and bone density separately, gives regional breakdowns, and involves a very small radiation dose, comparable to a few hours of background exposure. A scan typically costs somewhere in the region of a private ultrasound or blood panel and needs a clinic visit. It is the right call when a genuinely precise number matters, such as monitoring a medical condition or preparing for surgery.
Bod Pod (air displacement plethysmography) estimates body volume by measuring air displaced inside a sealed chamber, then converts that into a fat percentage using known tissue densities. It avoids radiation entirely and is fast, but access is limited mostly to university labs, sports science facilities, and specialist clinics, so it is not something most people can pop into on a Tuesday.
Hydrostatic (underwater) weighing is the older sibling of the Bod Pod, using water displacement instead of air. It is highly accurate in controlled conditions but cumbersome, requiring full submersion and a forceful exhale underwater, which makes it impractical for most people and rare outside research settings today.
Skinfold callipers pinch and measure subcutaneous fat at several body sites, then plug the results into a population-specific equation. They are inexpensive and portable, but accuracy depends almost entirely on the skill of the person taking the measurement. A technician who has taken thousands of readings will get far more consistent numbers than someone measuring themselves at home, where site selection and pinch pressure vary from one attempt to the next.
Professional-grade MFBIA units, the kind found in some gyms and clinics, sit between consumer scales and DEXA. They generally correlate well with DXA for total fat mass (correlations around 0.93 to 0.96) and offer useful regional detail, but the same underlying bias problem persists, and visceral fat estimates in particular remain far less reliable than total fat mass figures.
Putting it plainly:
- Choose DEXA when precision genuinely changes a decision, medical, surgical, or research-grade.
- Choose Bod Pod or hydrostatic weighing if you have lab access and want a radiation-free reference reading.
- Choose professional MFBIA for periodic athlete or client monitoring where a single consistent device is used every time.
- Choose skinfold callipers only if a trained, experienced technician is doing the measuring.
- Choose a consumer BIA scale for frequent, low-cost, at-home trend tracking, understanding its absolute number carries real error.
What throws off your body fat reading (and why)
Impedance is a measurement of your body’s electrical properties at one specific moment, so anything that shifts your fluid balance or tissue temperature in that moment shifts the reading, sometimes dramatically.
- Hydration state. More water in your tissues lowers impedance and typically pushes the reported body fat percentage down, so a well-hydrated reading and a dehydrated reading taken hours apart can look like real body composition change when nothing has actually changed.
- Recent food, drink, or alcohol. A large meal or fluid load shifts your internal water distribution for hours afterwards, which is why practitioner guidance consistently recommends measuring in a fasted state rather than after eating.
- Exercise before measuring. Sweating and increased blood flow to the skin both alter impedance readings, so a post-workout reading rarely matches a rested one.
- Skin temperature. Cold feet or hands increase resistance in ways unrelated to your actual fat content, which is one reason readings taken straight out of a cold shower can look strange.
- Device design. A leg-only stand-on scale simply cannot see what is happening in your torso and arms, while a segmental system that includes hand contacts captures more of your total body.
- Demographic assumptions baked into the algorithm. The equation behind your number assumes your body composition follows the pattern typical of your entered age, sex, and BMI category, so anyone whose physique sits outside that typical pattern, very muscular, very lean, or at an unusual age for their build, tends to get a less accurate estimate.
- Very high BMI, implants, or prosthetics. These can distort the electrical pathway the current is meant to follow, sometimes enough that manufacturers explicitly flag them as edge cases their algorithms were not built for.
Pro Tip: Measure at the same time of day, in the same state (ideally first thing in the morning, fasted, after using the bathroom), on the same surface, for at least four weeks before drawing any conclusion from your trend line. A single reading tells you almost nothing; twenty readings under identical conditions tell you a great deal.
Getting useful trend data from a home scale
Consistency is what turns a mediocre instrument into a genuinely useful one. Reliability, meaning a device gives you the same reading under the same conditions, is a different property from accuracy, meaning it matches a clinical reference. A scale can be highly reliable and still biased, which is exactly why the same protocol every time matters more than the brand of scale you buy.
Build a simple routine and stick to it:
- Weigh yourself first thing in the morning, after using the bathroom, before eating or drinking anything.
- Stand on bare feet, on the same flat, hard surface each time (carpet affects footpad contact and current flow).
- Take the reading on the same days each week rather than daily, if daily numbers make you anxious about noise.
When you look at the data, ignore any single day’s number entirely and look at the seven-day rolling average instead. A single reading can bounce two or three percentage points from hydration alone; a four-week trend line filtered through weekly averages filters most of that noise out and shows you the direction that actually matters.
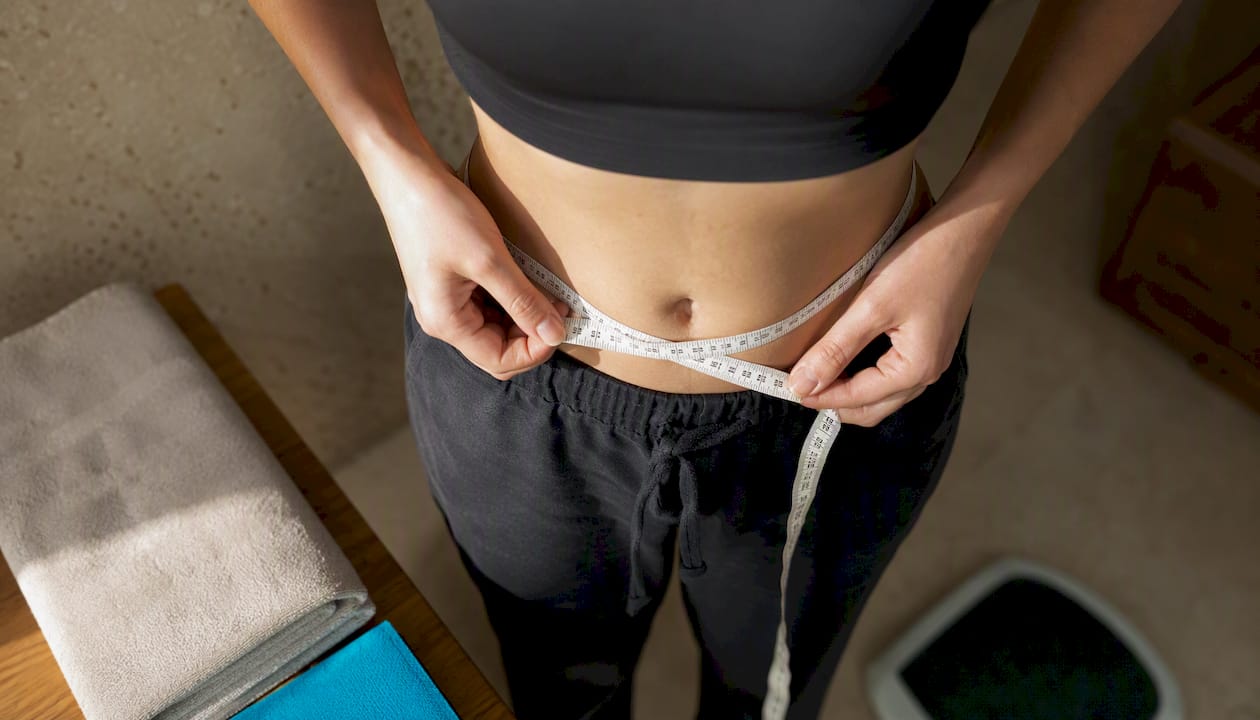
Pro Tip: Pair your scale readings with a monthly waist circumference measurement using a tape measure at the navel. Waist size correlates strongly with visceral fat and cardiometabolic risk, and combining it with body weight often tells you more about health risk than an imprecise body fat percentage alone.
When home tracking isn’t enough
Home devices are built for pattern spotting, not diagnosis, and a handful of situations genuinely call for professional testing instead. If a clinician is using body composition to diagnose a condition, plan a treatment, guide medication dosing, or assess surgical risk, a DEXA or multi-compartment method should be the basis for that decision, not a bathroom scale reading.
Competitive athletes cutting weight for a weight class, or anyone in a formal research study, also needs the tighter error margins that clinical-grade equipment provides. For everyone else, an annual or twice-yearly DEXA scan, layered on top of regular home tracking, gives you an accuracy check without the cost or inconvenience of frequent clinical visits. Most people simply do not need that level of precision more than once or twice a year.
Why context matters as much as the number itself
A body fat percentage on its own is a snapshot with a wide margin for error. What actually helps you interpret it is context: how your sleep has been, whether you trained hard the day before, how much you have been drinking, and how your recovery has trended over recent weeks. Reliable devices measure consistently, but consistency without context still leaves you guessing why a number moved.
This is where continuous tracking earns its place alongside periodic body composition checks. Wearables can record real-time heart rate, sleep quality, and daily activity, often through a companion app with no subscription fees, which lets you cross-reference a body fat trend against what was actually happening in your body that week.
- Data from health monitoring devices can help explain why a scale reading moved, not just that it moved.
- Sleep and recovery metrics add context that a single impedance reading cannot capture.
- None of this replaces DEXA or a Bod Pod, it complements a home scale’s trend data rather than competing with clinical accuracy.
Sam has spent years covering consumer health technology and translating validation research into practical guidance people can actually use without a science background.
Chase the trend, not the decimal point
Here is what I think most people get backwards: they treat body fat percentage like an exam score, something to obsess over to the decimal place, when the research says the number itself carries a genuine margin of error worth several kilograms of fat mass. That is not a reason to distrust your scale. It is a reason to stop expecting precision it was never designed to deliver.
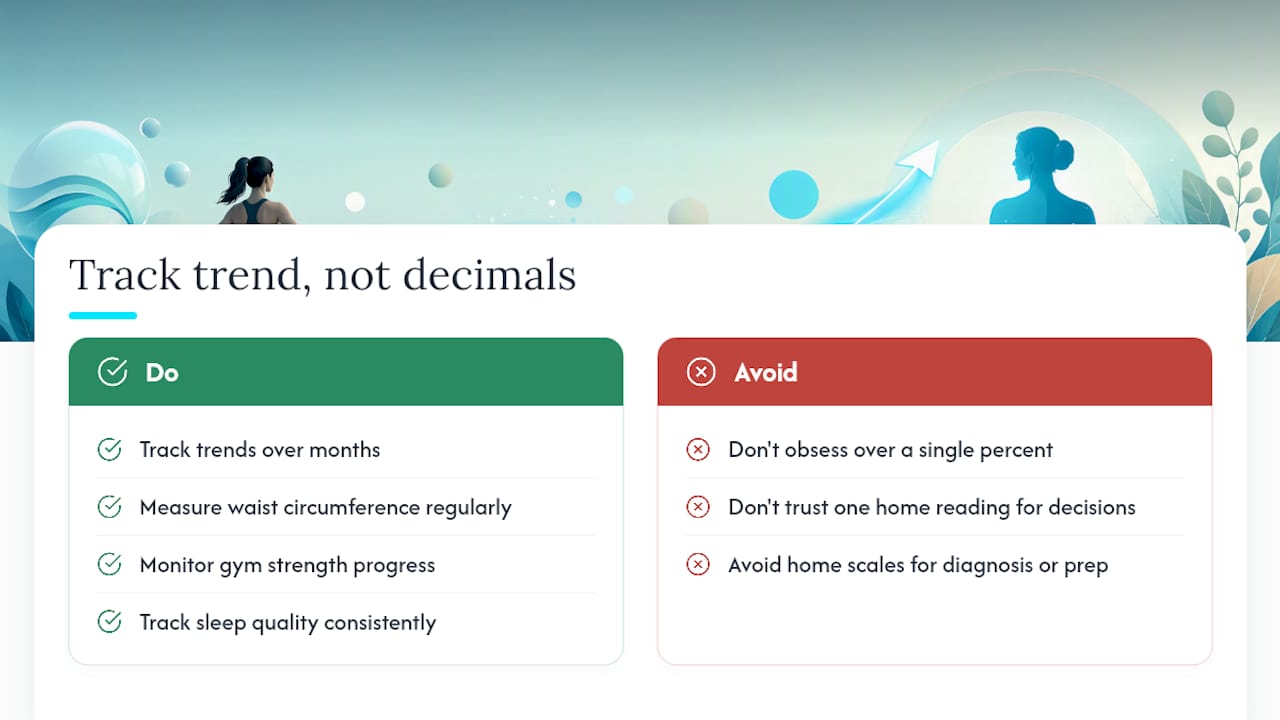
I would rather see someone track waist circumference, strength in the gym, and sleep quality over three months than fixate on whether their scale says 22% or 19% body fat this Tuesday. Those behaviour-linked metrics move for reasons you can actually control and act on. A single body fat reading moves for reasons that include what you drank yesterday.
Use the scale. Trust the slope of the line, not the point on it. And when a decision genuinely matters, a diagnosis, a medical plan, competition prep, put the home device down and book something more precise.
— Sam
How Voltra fits alongside your body fat tracking
If a bathroom scale tells you what changed, Voltra tells you more about why. It tracks real-time heart rate, sleep quality, recovery, and daily activity, all through a free app with no subscription fees, so a body fat trend that suddenly stalls or shifts has some actual context behind it: poor sleep that week, a spike in stress, or a training load that quietly crept up. Voltra is not a clinical body composition test and never claims to replace one; it is built to support the behaviour and recovery side of the equation that a scale alone cannot see.
If you are ready to add that context to your own tracking, the VOLTRA AIR is the simplest place to start, a single wearable that pairs with the free app and gives you daily readouts on sleep, heart health, and activity without a recurring fee. Order one, wear it for two weeks alongside your usual scale routine, and see how much more sense your trend lines start to make.
Sources
This article draws on peer-reviewed and independently tested research, including the JMIR mHealth smart scale validation study, its full PMC-hosted report, the MFBIA real-world validation study, Consumer Reports’ body-fat scale testing, and Live Science’s explainer on smart scale technology. Readers considering a professional DEXA scan can find further detail in this DEXA accuracy explainer. These sources underpin every figure and recommendation above.
This article is general information, not a substitute for advice from a qualified doctor. Consult a qualified healthcare professional about your own circumstances before acting on anything here.
- Accuracy of Smart Scales on Weight and Body Composition: Observational Study (PMC copy)
- How do smart scales measure body composition, and how accurate are they? | Live Science
- Body-Fat Scale Review - Consumer Reports
Share:
Cut Alcohol First, Breathe at Six: Improve HRV in 8–12 Weeks (UK)
Shrink Dangerous Belly Fat in 3 Months: Visceral vs Subcutaneous