

Muscle mass percentage is the proportion of your total body weight made up of skeletal muscle, and for many healthy adults it generally falls within a common range, with men typically running higher than women. A 468-person MRI study in the Journal of Applied Physiology found average skeletal muscle mass of roughly 38.4% in men and 30.6% in women, but the exact figure you get depends heavily on which method measured it.
TL;DR:
- Muscle mass percentage varies significantly by age and sex, with men typically having higher levels than women and a gradual decline starting around age 40.
- MRI, CT, and DEXA scans provide precise muscle mass measurements, while consumer BIA devices offer trend data affected by hydration and recent activity.
- Tracking absolute muscle mass in kilograms alongside percentage offers a clearer picture of genuine muscle gain or loss, especially when monitoring over several weeks.
- Resistance training, adequate protein intake, and proper recovery are essential to build and maintain muscle mass, particularly with aging.
- Consumer wearable devices are useful for trend tracking and motivation but should not replace clinical assessments for accurate muscle mass evaluation.
Table of Contents
- Muscle mass percentage averages by sex and age
- How muscle mass is actually measured
- Why your reading might be wrong (and what to trust instead)
- Why muscle mass percentage matters for your health
- How to build or preserve muscle mass
- Tracking muscle mass without fooling yourself
- A publisher’s honest view on wearables and body composition
- Track your progress without paying a monthly fee
- Sources
- FAQ
Muscle mass percentage averages by sex and age
The J Appl Physiol figures above came from whole-body MRI scans of 468 adults aged 18 to 88, which makes them one of the more reliable population benchmarks available. Muscle percentage tends to fall gradually as people age, a pattern documented in reviews of age-related muscle decline, with the drop becoming more noticeable from midlife onwards as hormone levels shift and physical activity often decreases.
Rough age brackets, drawn from imaging-based population data, look something like this:
- Men, 20 to 39: typically towards the higher end of the range, often 38 to 42%
- Men, 40 to 59: a gradual decline, commonly 35 to 38%
- Men, 60 and over: noticeably lower, often 32 to 35%
- Women, 20 to 39: typically 28 to 32%
- Women, 40 to 59: slight decline, often 27 to 30%
- Women, 60 and over: commonly 25 to 28%
Treat these as guide bands, not diagnostic cut-offs. Nutrients has pointed out that published reference values vary widely depending on the normalisation method used, whether that’s percentage of body weight, adjustment for height squared, or a BMI-based formula. Comparing a reading from a home scale against a study that used MRI is comparing two different rulers.
How muscle mass is actually measured
Clinics and researchers rely on three imaging methods when precision matters: MRI, CT, and DEXA. These scan tissue directly, distinguishing muscle from fat and bone with far greater accuracy than anything you can do at home, which is why Healthline calls them the closest thing to a gold standard for muscle assessment.
Most consumer devices, including smart scales and handheld body composition monitors, use bioelectrical impedance analysis (BIA) instead. BIA sends a low-level electrical current through your body and estimates lean mass based on how quickly it travels, since muscle holds more water than fat and conducts electricity more easily. That’s a reasonable proxy, but it’s an estimate built on assumptions about hydration, not a direct measurement of tissue.
In practice:
- Choose an imaging scan (MRI, CT, or DEXA) if you need a precise, clinical-grade number, usually through a GP referral or private clinic.
- Choose a BIA scale or wearable if you want frequent, low-cost readings to monitor trends over weeks and months.
- Repeat the same device under the same conditions every time. Consistency matters more than the brand of scale you buy.
Why your reading might be wrong (and what to trust instead)
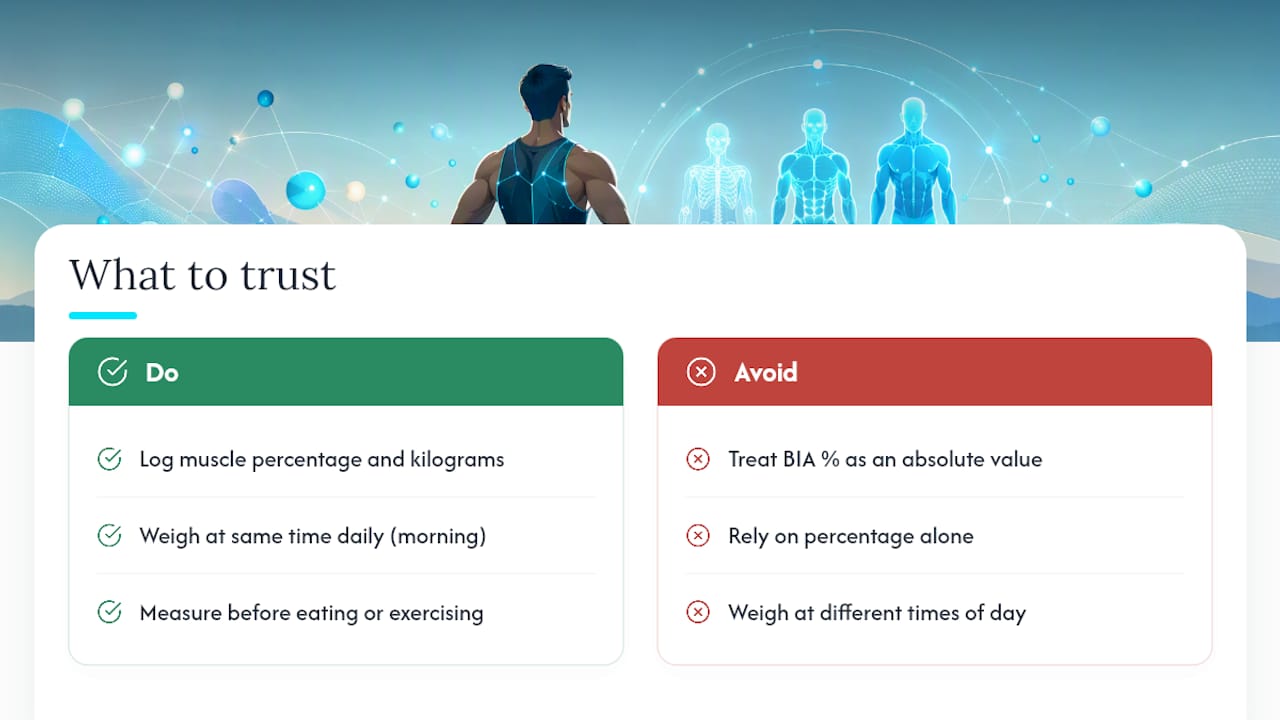
BIA readings shift for reasons that have nothing to do with actual muscle change. Hydration status, a meal eaten an hour ago, recent exercise, and even room temperature can all nudge the number, because the device is really measuring body water and inferring muscle from it. Medical News Today notes that consumer readings should be treated as trend indicators, not absolute values you’d stake a diagnosis on.
There’s also a distinction worth holding onto: percentage versus absolute mass. If you lose fat while muscle stays flat, your muscle percentage rises even though you haven’t gained a single gram of muscle. Tracking kilograms of muscle alongside the percentage separates genuine muscle growth from a shift caused purely by fat loss.
This matters clinically too. A person can carry a high body fat percentage while their muscle quality and strength quietly decline, a pattern called sarcopenic obesity, where muscle quality deteriorates even as the scale shows a seemingly normal or high overall weight. Percentage alone can mask this.
Pro Tip: Weigh and measure at the same time of day, ideally first thing in the morning before eating or exercising, and log both the percentage and the absolute kilogram figure every time.
Why muscle mass percentage matters for your health
Muscle isn’t just about aesthetics or lifting heavier weights. It’s active tissue that burns energy at rest, supports blood sugar regulation, and underpins basic mobility, from climbing stairs to standing up from a chair without using your arms. Low muscle mass in older adults is linked to a clinical condition called sarcopenia, associated with higher fall risk, slower recovery from illness, and reduced independence.
Strength and function matter as much as the raw percentage figure. Medical News Today’s clinical guidance emphasises that muscle quality and strength are often more relevant to long-term health outcomes than an isolated number on a scale readout. Two people with identical muscle percentages can have very different grip strength and functional capacity.
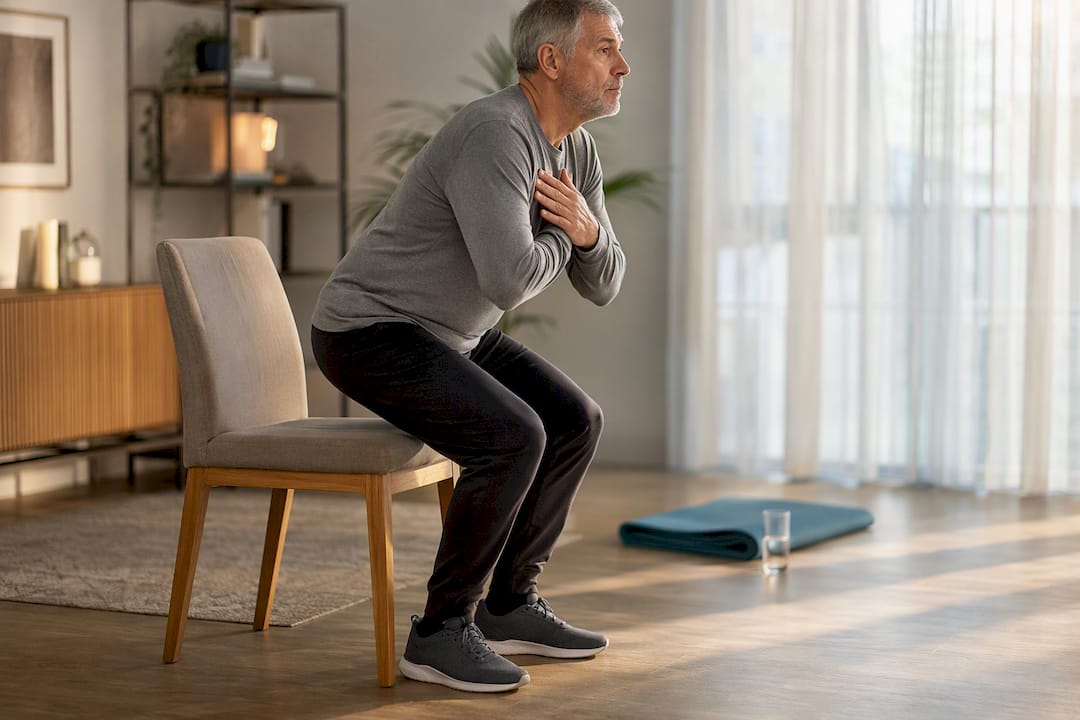
Age-related decline in muscle mass, sometimes called sarcopenia when it becomes clinically significant, tends to accelerate from around age 40 onwards and picks up further pace after 60, though the rate varies enormously between individuals depending on activity levels, protein intake, and hormonal factors. This isn’t inevitable in the way it’s often presented. It’s a pattern that responds directly to what you do with your body.
How to build or preserve muscle mass
Resistance training is the single most effective lever available, and the NHS recommends strength exercises targeting all major muscle groups at least twice a week. Beyond that baseline, a few principles separate people who make steady progress from those who plateau:
- Apply progressive overload. Gradually increase weight, reps, or sets over time; muscles only adapt when asked to do slightly more than they’re used to.
- Train each muscle group two to three times weekly, with at least one rest day between sessions targeting the same muscles.
- Hit a protein target of roughly 1.2 to 1.6g per kilogram of bodyweight daily, spread across meals rather than loaded into one sitting.
- Eat enough overall. Muscle building in a significant calorie deficit is far harder; a modest surplus or maintenance intake supports growth better than aggressive restriction.
- Prioritise sleep and recovery days. Muscle repair happens between sessions, not during them.
If you’re new to training or working out at home, a simple home gym setup with adjustable dumbbells and resistance bands covers most of what a beginner routine needs, and progression matters more than fancy equipment.
Tracking muscle mass without fooling yourself
Set a fixed protocol and stick to it: same time of day, same hydration state, ideally before eating or training rather than after, since post-workout fluid shifts can distort BIA readings for hours. Record three numbers every time, not one: muscle mass percentage, absolute muscle mass in kilograms, and which device or method produced the reading.
A single measurement rarely means much. BIA scales can swing by a percentage point or two day to day purely from water retention, so a single lower reading after a salty meal isn’t muscle loss. What matters is the direction of the trend line across four to six weeks. If both your percentage and your kilogram figure are climbing steadily over that window, something real is happening; if only the percentage shifts while kilograms stay flat, look at fat loss as the likelier explanation.
A publisher’s honest view on wearables and body composition
Consumer devices are genuinely useful for spotting trends and nudging behaviour, tracking whether resistance training and better sleep are moving your numbers in the right direction week to week. They were never built to replace a diagnostic scan, and no wearable should be read as a clinical verdict on your health. Voltrahealth’s own position is that free, frequent trend data has real value precisely because it’s used alongside good judgement, not instead of it.
— Sam
Track your progress without paying a monthly fee
Most fitness wearables lock body composition trends, sleep scores, and heart health data behind a subscription, which turns tracking your muscle mass percentage into a recurring cost just to see your own numbers. Voltra offers a wearable that tracks body composition trends, sleep quality, heart health, and daily activity, and provides app access without recurring fees.

That’s the practical difference for anyone using this article to interpret their own readings. A clinic scan gives you a precise snapshot once; a device like VOLTRA AIR gives you the repeated, same-conditions data you need to actually see a trend develop over weeks, which is exactly the protocol this article recommends.
If you want to start logging your own muscle mass trend the right way, from the same device under the same conditions, check the current Voltra tracker bundles and get set up this week.
Sources
- Skeletal muscle mass and distribution in 468 men and women aged 18–88 yr (J Appl Physiol 2000)
- Reference values for skeletal muscle mass – methodological considerations (MDPI Nutrients)
- Muscle mass percentage: Healthline explainer
- How to improve strength and flexibility (NHS)
- Muscle mass percentage: benefits and how to calculate it (Medical News Today)
FAQ
Is 75% muscle mass good?
A reading that high almost always signals a calculation or device error rather than an unusually muscular body.
Is 35% muscle mass good for a woman?
Yes, 35% sits above the typical female average of around 30.6% found in MRI-based population data, placing it towards the higher end of the healthy range, particularly for an active woman under 40.
Is 150 muscle mass good?
A figure like 150 makes sense only as absolute muscle mass in kilograms or pounds, not as a percentage. Whether that amount of muscle is good depends entirely on your total body weight and height, since it needs dividing by total bodyweight to produce a meaningful percentage.
Share:
Increase Deep Sleep in 4–6 Weeks With a Wearable Test Plan
Evidence First Cycle Syncing Workouts for UK Women: Track 2–3 Cycles