
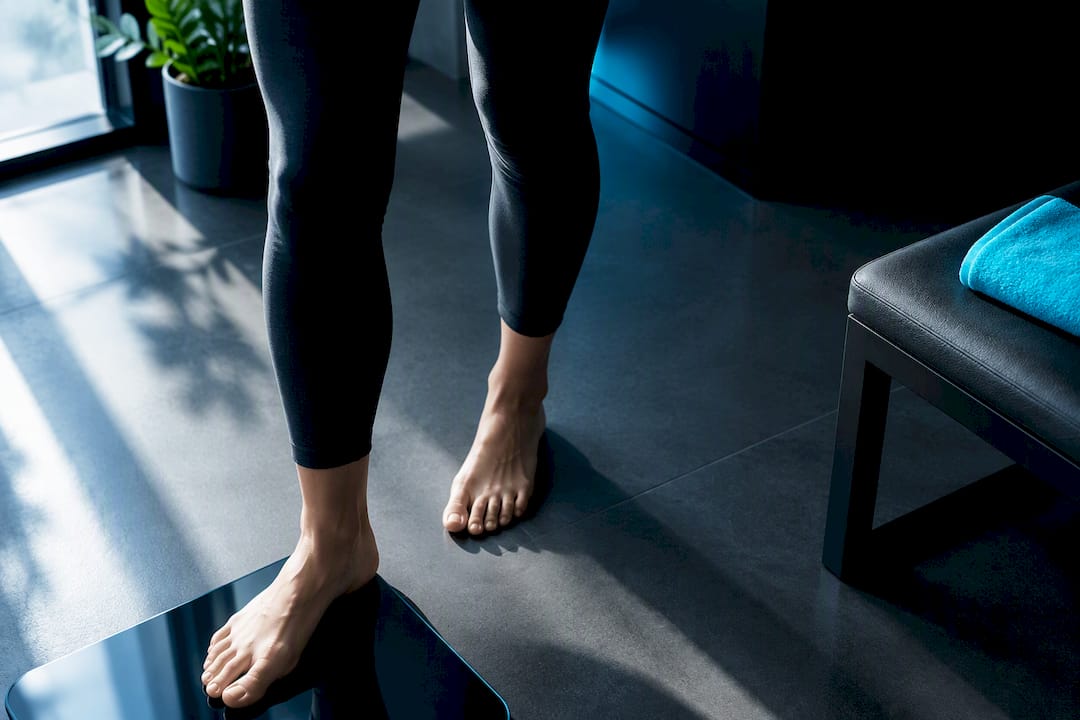
Home smart scales produce a calculated estimate of bone mass using bioelectrical impedance, useful for spotting trends but not for diagnosing anything. That number on your app screen is a mathematical prediction, not a direct measurement of the calcium in your skeleton. It can help you notice a change in your body over months, but it cannot tell you whether you have osteoporosis, and it should never replace a clinical scan when that question actually matters.
TL;DR:
- Home bioelectrical impedance scales estimate bone mass as a prediction based on impedance measurements, not a direct assessment of bone density.
- Hydration status and measurement conditions can cause significant short-term fluctuations, so consistent testing routines are essential for tracking trends.
- The correlation between BIA estimates and clinical DXA scans is moderate, but BIA systematically underestimates bone mineral density and cannot replace DXA for diagnosis.
- Single home measurements are unreliable; focus on trends over several weeks and consult a healthcare professional for any concerning changes or clinical questions.
- Consumer devices provide useful trend data but should be supplemented with clinical assessments when accurate diagnosis or treatment decisions are required.
Table of Contents
- How consumer scales estimate bone mass
- Main factors that alter accuracy
- How BIA-based bone-mass estimates compare with DXA
- A measurement routine that improves consistency at home
- Publisher evidence and resources for accurate tracking
- Comparing bone mass measurement methods beyond BIA and DXA
- What else affects bone mass scale accuracy
- Common misconceptions about bone mass scale accuracy
- What the numbers can and can’t tell you
- Tracking bone mass consistently without a subscription
- Sources
- FAQ
How consumer scales estimate bone mass
A bone mass scale does not look at your bones at all. It sends a low-amplitude alternating current through your body and measures how much your tissue resists that current, a property called impedance. Impedance has two parts: resistance, which comes largely from fluid-rich tissue such as muscle and blood, and reactance, which comes from the way cell membranes store and release a small electrical charge. Together, these two raw variables produce a phase angle, a value that reflects the health and hydration of your tissue.
None of that is bone. The scale’s software takes your impedance readings, combines them with your height, weight, age and sex, and runs them through a regression equation built from population data. That equation produces an estimated bone mass figure. It is a prediction based on statistical relationships observed in other people, not a scan of your skeleton, which is why two people with identical bones but different muscle or fluid levels can get different readings.
The physical setup of the scale changes how much information it actually captures:
- Foot-to-foot scales pass current through the lower body only, missing the arms and trunk almost entirely.
- Foot-to-hand designs add an upper-body pathway, giving a fuller picture of the whole body.
- Segmental devices measure each limb and the trunk separately, which improves detail but still relies on the same underlying assumptions.
A Frontiers in Physiology review explains that multi-frequency devices, which send current at several frequencies rather than one, can distinguish different tissue compartments more precisely, but even these still depend on population-matched calibration to produce a meaningful number. Without that matching, the algorithm is guessing with better tools.
Main factors that alter accuracy
Several everyday factors shift a bioelectrical impedance analysis (BIA) reading before the algorithm ever gets to bone mass. Some are short-term and reversible within hours, others reflect longer-term limits in how the equations were built.
- Hydration status is the single biggest short-term influence on impedance readings, since water conducts electricity far more efficiently than fat or bone.
- Recent exercise, a large meal, or alcohol in the last few hours can all shift fluid distribution and skew the reading.
- Time of day matters too, since fluid tends to redistribute as you move around during the day.
- Poor electrode contact, wet or dry feet, thick calluses, and dirty scale plates all interfere with the current path.
- Manufacturer equations are built from specific population samples, so athletes, older adults and people outside the reference group may get systematically skewed estimates.
Hydration is the hidden variable that typically causes the largest short-term shifts in impedance-derived body composition numbers, according to research on hydration’s influence on BIA, and consistent pre-measurement habits meaningfully reduce that noise. A narrative review of body composition assessment in athletes found that population-specific equations and standardised protocols improve monitoring accuracy, but without them, device accuracy for a given individual is limited. Someone who trains heavily, or who falls outside the age and body-type range the equation was built for, may see numbers that do not reflect their actual physiology, even if the trend direction over time is still informative.
How BIA-based bone-mass estimates compare with DXA
Dual-energy X-ray absorptiometry, known as DXA, is the clinical gold standard for measuring bone mineral density. A DXA scan produces a T-score and a Z-score that clinicians use to classify bone health: a T-score of -1.0 or above is normal, a score between -1.1 and -2.4 indicates osteopenia, and a score of -2.5 or below suggests osteoporosis.
A peer-reviewed comparison of BIA and DXA published in Scientific Reports tested a standing BIA device against DXA for whole-body bone mineral density and found a moderate-to-high correlation, with a Pearson coefficient of roughly 0.737. That sounds reassuring until you look at the bias: BIA systematically underestimated bone mineral density compared with DXA, with an average underestimation and limits of agreement that indicate notable individual variation.
That range matters more than the correlation figure. A strong correlation means the two methods tend to move in the same direction across a group of people, but wide limits of agreement mean an individual reading from BIA could be meaningfully off from what a DXA scan would show for that same person on that same day.
- Correlation tells you whether two methods rank people similarly.
- Limits of agreement tell you how far apart a single pair of readings can be for one person, which is the number that actually matters for interpreting your own scale.
In practice, this means a home BIA reading is not interchangeable with a DXA result. If a clinical question about fracture risk, osteopenia or osteoporosis is on the table, only DXA gives the precision needed to answer it.
A measurement routine that improves consistency at home
Reducing noise in your own bone mass tracking starts before you ever step on the scale. This sequence, drawn from the physiological factors above, gives your readings the best chance of reflecting a real change rather than a random fluctuation.
- Weigh yourself at roughly the same time each day, ideally first thing in the morning before eating or drinking.
- Keep your meal and hydration status consistent between measurements, since a big meal or several glasses of water the night before can shift the number.
- Avoid heavy exercise or alcohol in the hours before you measure, since both alter fluid distribution.
- Step on barefoot, with dry, clean feet placed exactly on the marked electrode plates.
- If your scale has a hand grip, hold it correctly with both hands and avoid letting your arms touch your torso, since skin-to-skin contact can create a false current path.
- Wipe the electrode plates clean occasionally and check that your profile details (age, sex, height) are entered correctly, since these feed directly into the regression equation.
- Keep the app and firmware updated, since manufacturers occasionally refine their algorithms.
Pro Tip: Take your first reading of a new tracking period on a normal day, not the morning after a big night out or an intense training session, so your baseline isn’t already skewed.
Even with a tight protocol, expect some week-to-week noise. A single reading rarely means much on its own. Give a trend at least three to four weeks of consistent measurements before treating a change as meaningful, and treat any single outlier with suspicion until it repeats. If you notice a rapid, unexplained decline that persists across several consistent readings, or if you have risk factors such as a prior fracture, that is the point to raise it with a clinician and ask about a DXA scan rather than trying to resolve it with more home readings.
Publisher evidence and resources for accurate tracking
Voltra has published a research-backed seven-step protocol for bioimpedance scale accuracy that expands on the measurement routine above, covering the specific timing, contact and profile details that reduce noise in impedance-based readings. It is written as practical guidance for home tracking, not as a substitute for clinical assessment.
For readers who want to see how trend monitoring plays out over weeks rather than single readings, Voltra’s case studies on body-fat percentage accuracy and tracking real muscle mass changes over four to six weeks apply the same underlying logic: consistent conditions, repeated measurement, and interpreting the direction of change rather than any single number.
- These resources are publisher materials describing how to get the most consistent readings from a home device.
- They are not a replacement for a clinical DXA scan when a genuine diagnostic question is at stake.
- Anyone with specific concerns about bone health should treat home data as a starting point for a conversation with a clinician, not an answer in itself.
Comparing bone mass measurement methods beyond BIA and DXA
DXA and BIA are not the only ways to assess bone. Quantitative ultrasound sends sound waves through peripheral bones, usually the heel, and is sometimes used in pharmacies or community screening because it is portable and avoids radiation, though it measures bone quality indirectly rather than the density figures clinicians rely on for diagnosis. Quantitative CT scanning can produce a three-dimensional density measurement and is occasionally used in research or specific clinical cases, but it involves a higher radiation dose than DXA and is far less widely available.
Against that landscape, DXA remains the method clinicians use to actually diagnose osteopenia or osteoporosis, because it is standardised, produces the T-scores and Z-scores used in treatment decisions, and has decades of reference data behind it. Ultrasound and CT each have a role, but neither has displaced DXA as the clinical reference point for bone health decisions. Home BIA scales sit at the opposite end of this spectrum: convenient and repeatable, but built for trend tracking rather than the kind of precision these clinical tools provide.

What else affects bone mass scale accuracy
Hydration and timing get most of the attention, but two other factors quietly shape how reliable your number is. Your overall body composition matters, because the regression equations behind bone mass estimates were built using data from specific populations, and someone with unusually high muscle mass, very low body fat or a body shape outside the reference range can get an estimate that does not track well with their actual physiology.
Electrode placement is just as important as the equation itself. If your feet are not fully aligned with the metal plates, or if you shift your weight during the reading, the current path through your body changes and so does the result. The MDPI review of proprietary algorithms in consumer devices notes that many manufacturers do not disclose exactly how their equations are built, which makes it harder for users or independent researchers to know how sensitive a given device is to these placement and composition issues. Consistency in how you stand, where you place your feet and how you hold any hand grips matters as much as anything else on this list.
Common misconceptions about bone mass scale accuracy
The biggest misconception is that a bone mass reading in kilograms or pounds is a direct measurement of skeletal mineral content, comparable to what a DXA scan reports. It is not: it is a statistical estimate derived from impedance and body metrics, and the units on your app are not the same units a clinician uses to diagnose osteoporosis.
A second common mistake is treating a single reading as meaningful on its own. Because hydration and other short-term factors can shift the number from one day to the next, one measurement tells you very little; the trend across weeks is where the useful information lives. A third misconception is assuming that because a scale is “more accurate” than a cheaper model, it can substitute for a clinical scan. No consumer device, however well calibrated, replaces the resolution and standardisation of DXA when a genuine diagnostic question is on the table. Finally, some people assume a low reading automatically signals a problem, when it may simply reflect where they sit relative to the population the equation was built from, rather than an actual decline in bone health.
What the numbers can and can’t tell you
Home scales are genuinely useful for noticing direction of change over time, and that is a reasonable reason to use one. But clinical decisions about bone health should rest on DXA results and a clinician’s judgement, not on an app trend line. Certain signals warrant a referral regardless of what your scale shows: a fracture from a minor fall, a rapid decline across several consistent readings, or entering a higher-risk period such as menopause. When you do bring home data to a clinician, present it as a trend, not a diagnosis, and let them decide whether it warrants a DXA scan.
— Sam
Tracking bone mass consistently without a subscription
Some health tracking scales are built around the principle that consistent, repeated measurement matters more than any single number. These devices track bone mass alongside body fat, muscle and hydration, sometimes offering access to your data without recurring fees once you have bought the hardware.
- Many devices give lifetime access to companion apps, allowing trend data to stay usable as long as you keep measuring.
- If you have a specific clinical concern about your bones, pair your Voltra readings with a professional assessment rather than relying on the app alone.
- For hydration-related accuracy tips relevant to your readings, an electrolyte and hydration guide from Elmntlab covers how fluid balance affects performance and measurement consistency.
If you are ready to start tracking your own trends, the VOLTRA AIR is a straightforward starting point at £99.99 one-off, with no subscription attached.
This article is general information, not a substitute for advice from a qualified doctor. Consult a qualified healthcare professional about your own circumstances before acting on anything here.
Sources
FAQ
What can throw off a bone density test?
For a clinical DXA scan, metal objects, recent barium contrast studies or nuclear medicine tests can interfere with results, which is why preparation guidance asks patients to remove metal before scanning. For a home BIA scale, hydration, recent exercise, meals and electrode contact are the main sources of a skewed reading.
What is normal bone density for a 70 year old?
Normal bone density is not defined by age but by T-score: a T-score of -1.0 or above is considered normal at any age, while -1.1 to -2.4 indicates osteopenia and -2.5 or below suggests osteoporosis. Only a clinical DXA scan can generate this score reliably.
What should my bone mass be on my scale?
There is no single target figure, since home scale bone mass is a calculated estimate that varies by device, algorithm and your personal profile data rather than a standardised clinical measurement. It is far more useful to track whether your own number stays stable or shifts over several weeks than to compare it against a fixed benchmark.
Is a bone mass of 6.6 lbs good?
A bone mass reading like this cannot be judged as “good” or “bad” in isolation, because home scales use proprietary regression equations that are not standardised across manufacturers or validated against DXA at the individual level. What matters more is whether that number stays consistent over time under similar measurement conditions, rather than how it compares to a generic benchmark.
Share:
Avoid Injury: Five Heart Rate Zones With UK Safety Checks
Hydration percentage scale: how to buy and use one for reliable trend tracking