Sleep efficiency is the percentage of time spent actually asleep during a defined sleep interval, most often the time you spend in bed. Sleep efficiency around 85% or higher is commonly considered good, while lower percentages typically signal fragmented, poor-quality sleep even if total hours look adequate. The exact number depends heavily on how it’s measured, so the same night can score differently on a polysomnogram than on a wrist-worn tracker.
TL;DR:
- Sleep efficiency measurements vary depending on whether they are calculated against time in bed or sleep episode duration, affecting interpretation and thresholds.
- Consumer wearables differ from polysomnography by about 4.7 percentage points on average, making them useful for trend tracking but unreliable for precise diagnosis.
- Improving sleep efficiency involves addressing prolonged sleep onset latency and wake after sleep onset through behavioral interventions like stimulus control and sleep restriction.
- Persistent low sleep efficiency below 75% over several weeks, especially with symptoms like snoring or daytime sleepiness, warrants medical evaluation for conditions like sleep apnea.
- Tracking sleep over 4 to 6 weeks with a device and diary helps identify behavioral causes of poor sleep, without ongoing subscription costs.
Table of Contents
- What is sleep efficiency? The formula and denominator problem
- How is sleep efficiency measured? PSG, actigraphy, diaries and wearables compared
- What counts as good sleep efficiency?
- Why sleep efficiency drops: SOL, WASO and common causes
- How to improve sleep efficiency, step by step
- How accurate are sleep trackers, really?
- When should you see a doctor about poor sleep efficiency?
- What Voltra’s own data shows about tracking sleep efficiency
- The number matters less than what’s driving it
- Track sleep efficiency without paying a monthly fee for the privilege
- Sources
- FAQ
What is sleep efficiency? The formula and denominator problem
The standard formula is simple: sleep efficiency (%) = total sleep time (TST) ÷ chosen interval × 100. The complication is which interval you use as the denominator since it changes the number more than most people realise.
Two options dominate clinical and consumer use:
- Time in bed (TIB): the full period from lights-out to final rise, including time spent lying awake.
- Duration of the sleep episode (DSE): sleep onset latency (SOL) plus TST plus wake after sleep onset (WASO), plus any time spent trying to sleep after a final awakening, deliberately excluding time spent reading or scrolling before you actually attempt sleep.
Researchers have argued that TIB can unfairly penalise people who spend time in bed on non-sleep activities, and have proposed DSE as a more precise denominator that better reflects true sleep continuity rather than bedroom habits.
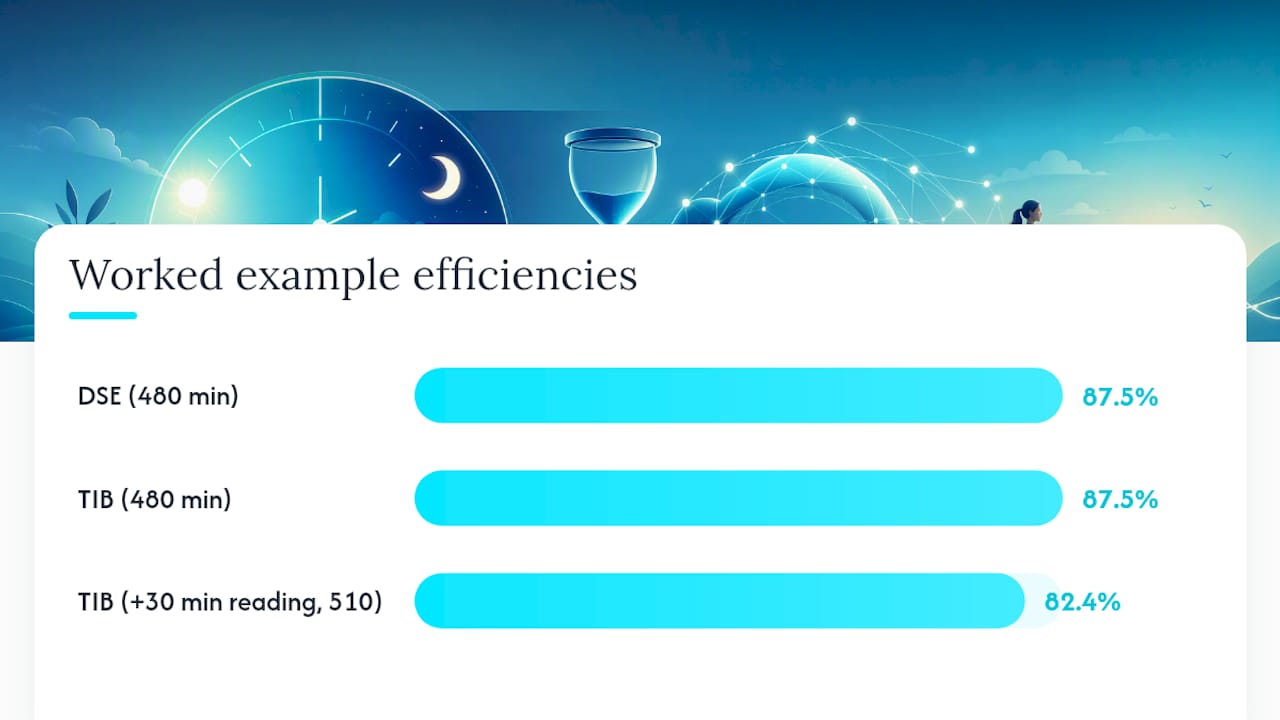
Here’s a worked example. Say you spend 8 hours (480 minutes) in bed, take 20 minutes to fall asleep, wake for 40 minutes across the night, and sleep for 420 minutes total. Using TIB as the denominator: 420 ÷ 480 × 100 = 87.5%. Using DSE (20 + 420 + 40 = 480 minutes, coincidentally the same here since there’s no extra time after final waking) the figure matches, but if you’d spent an extra 30 minutes reading before attempting sleep, TIB would drop to 420 ÷ 510 = 82.4%, while DSE stays at 87.5%. Same night, different verdict, depending purely on the yardstick.
How is sleep efficiency measured? PSG, actigraphy, diaries and wearables compared
Four methods dominate sleep measurement, and each answers a slightly different question.
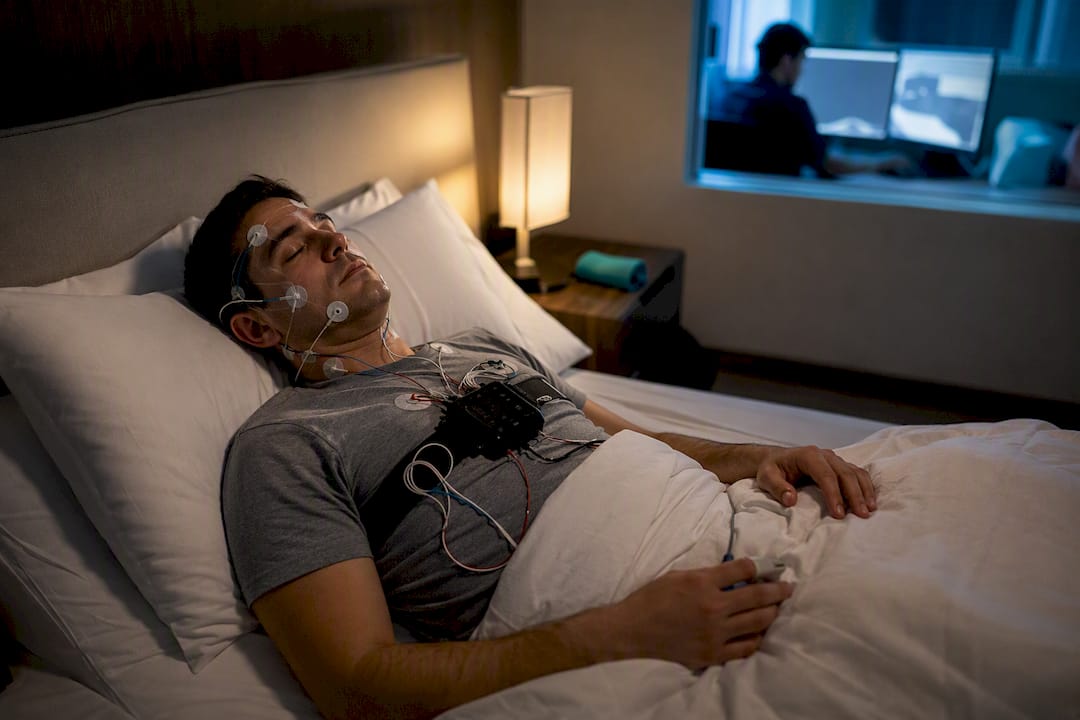
Polysomnography (PSG) remains the reference standard. It records brain waves, eye movement, and muscle activity in 30 second epochs, scored by a technician against American Academy of Sleep Medicine criteria, which lets it distinguish wake from light, deep, and REM sleep with precision no consumer device matches. It’s typically only available in a sleep lab or clinical setting, which limits its use to diagnostic workups rather than everyday tracking.
Actigraphy uses a wrist-worn accelerometer to infer sleep from movement patterns, validated against PSG in research settings, and requires the wearer or a technician to mark bedtime and rise time manually, which affects the denominator.
Sleep diaries rely on self-reported bed and wake times plus estimated time to fall asleep, and are cheap and easy but vulnerable to memory bias, particularly around how long someone thinks they lay awake.
Consumer wearables estimate sleep from a mix of accelerometer data, heart rate, and sometimes skin temperature.
- PSG: gold standard, lab based, scores actual brain activity
- Actigraphy: movement based, validated, needs manual bed/rise markers
- Sleep diary: subjective, cheap, prone to recall error
- Consumer wearables: good at overall timing, weaker at distinguishing wake from light sleep
A meta-analysis of 24 studies found that consumer wrist devices differ from PSG by a mean of 4.7 percentage points on sleep efficiency, with similar gaps on total sleep time and WASO. That gap matters most when a device reports borderline scores hovering near a clinical threshold, because the margin of error can flip a “good” night into a “poor” one on paper.
What counts as good sleep efficiency?
Clinical glossaries commonly treat 85% or higher as the threshold for normal sleep efficiency, with 90% and above often described as excellent. Below roughly 75%, most clinicians would flag marked sleep fragmentation worth investigating.
These numbers are guides, not verdicts, for a few reasons:
- The threshold shifts depending on whether TIB or DSE was used as the denominator.
- A high percentage doesn’t guarantee adequate sleep if total time in bed was too short to begin with.
- Daytime function (alertness, mood, concentration) matters as much as the raw percentage.
- A single night tells you little; a run of 7 to 14 nights gives a genuinely useful baseline.
Someone who spends 6 hours in bed and sleeps for 5.5 might post 91.6% efficiency, technically excellent, while still being short on total sleep. Efficiency measures continuity, not sufficiency.
Why sleep efficiency drops: SOL, WASO and common causes
Two components drive nearly every low score: sleep onset latency (SOL), the time it takes to fall asleep, and wake after sleep onset (WASO), the minutes spent awake after you’ve already dropped off. Both inflate the denominator without adding to total sleep time, and identifying which one is doing the damage matters more than the headline percentage.
Common causes split roughly along those lines:
- Extended SOL: behavioural insomnia, pre-bed anxiety, hyperarousal, screen use, irregular bedtimes
- Extended WASO: obstructive sleep apnoea, chronic pain, alcohol close to bedtime, certain medications, nocturia
- Both: circadian misalignment (shift work, jet lag), generalised anxiety disorder
A quick way to tell them apart: if you fall asleep within 20 minutes but wake repeatedly through the night, look at breathing (snoring, gasping) or alcohol timing before assuming stress is the culprit. If falling asleep itself is the struggle, that points toward pre-sleep arousal or an inconsistent schedule rather than a nighttime disruption. Anxiety in particular can drive both patterns at once, which is worth understanding in more depth if racing thoughts are a nightly feature.
Pro Tip: Track the time you actually feel sleepy, not just when you go to bed. If your SOL is consistently over 30 minutes, you’re probably getting into bed before your body is ready, not failing at sleep itself.
How to improve sleep efficiency, step by step
Improving sleep efficiency means shrinking SOL and WASO, not just spending less time in bed. The interventions with the strongest evidence behind them come from behavioural sleep medicine, not lifestyle blogs.
- Apply stimulus control. Go to bed only when sleepy, get up if you’re awake for more than 20 minutes, and use the bed only for sleep. This retrains the association between bed and sleep rather than bed and frustration.
- Consider sleep restriction or full CBT-I. Deliberately limiting time in bed to match actual sleep time, then gradually extending it, is a core technique in cognitive behavioural therapy for insomnia and routinely used as the outcome measure clinicians track. It’s worth working with a trained therapist rather than self-prescribing, since restricting sleep too aggressively can backfire.
- Fix the obvious lifestyle levers. Cut caffeine after early afternoon, keep alcohol away from the three hours before bed (it fragments sleep even though it speeds up SOL), get daylight exposure early in the day, and keep the bedroom cool and dark.
- Hold a consistent rise time, even on weekends. This does more for circadian stability than a fixed bedtime.
- Track trends, not nights. Pair a simple sleep diary with a wearable’s multi-night data, comparing weekly averages rather than obsessing over one bad reading, which is a genuinely effective way to speed up gains if you’re also making the changes above.
Pro Tip: Give any single change at least two weeks before judging it. Sleep efficiency moves slowly, and a wearable’s night-to-night noise can easily mask a real, gradual improvement.
How accurate are sleep trackers, really?
Consumer wearables are reasonably good at detecting when you’re asleep versus awake at a broad level, but weaker at the finer details clinicians care about. The pooled meta-analysis mentioned earlier found a mean difference of roughly 4.7 percentage points against PSG for sleep efficiency, with comparable gaps on WASO.
Device-level validation studies tell a more nuanced story than “trackers are inaccurate.” One study comparing three commercial wearables against PSG found that some devices came close to matching PSG on overall sleep efficiency while still misjudging sleep latency and individual sleep stages by wider margins. In other words, a device can get the headline number roughly right while getting the reasons behind it wrong.
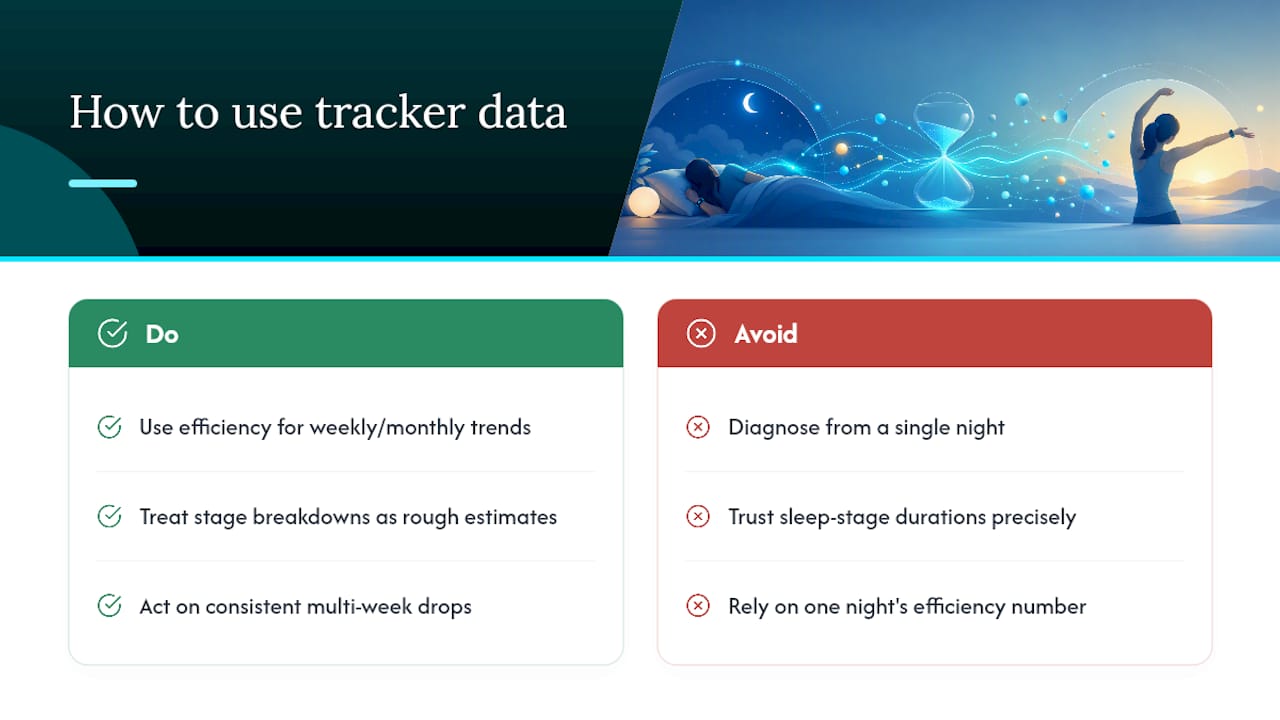
The practical rule: use tracker-reported sleep efficiency to spot trends across a week or a month, not to diagnose a disorder from a single night. Expert reviews of tracker accuracy consistently find that duration and timing hold up reasonably well while sleep-stage detection does not, which is exactly the distinction worth remembering when a device tells you that you spent 90 minutes in deep sleep. Treat that stage breakdown as a rough estimate, and treat a consistent multi-week drop in efficiency as the signal worth acting on.
When should you see a doctor about poor sleep efficiency?
Persistently low sleep efficiency, below roughly 75% over several weeks despite adequate time in bed, is worth raising with a GP, especially alongside daytime sleepiness, loud snoring, gasping during sleep, or difficulty concentrating.
Bring two weeks of diary data and a device trend summary to the appointment if you have one; it gives a clinician far more to work with than a single bad night’s story. A GP may use screening questionnaires, refer you for actigraphy or a home sleep study, or in more complex cases refer you for overnight polysomnography. Suspected obstructive sleep apnoea, in particular, needs proper testing rather than tracker inference, since wearables are not built to diagnose it. Where insomnia looks like the driver, referral for CBT-I is often the next practical step.
What Voltra’s own data shows about tracking sleep efficiency
Voltrahealth’s wearables track sleep, heart health, and daily activity without a subscription, and the company reports more than 100,000 customers and 85% of users noting improved sleep quality within 14 days of use. That’s company-reported evidence, not an independent peer-reviewed trial, and it should be read as a claim about typical outcomes rather than a guaranteed result for every user.
A realistic way to use that kind of data: run a 4 to 6 week plan combining a Voltra device with a simple written sleep diary.
- Log bedtime, estimated SOL, and rise time each morning for the first two weeks as a baseline.
- Compare weekly device-reported efficiency averages, not single nights, against that baseline.
- Introduce one behavioural change at a time (fixed rise time, no late caffeine) and watch the trend line over the following fortnight.
The number matters less than what’s driving it
The percentage is a starting point, not a verdict. Focus on whether SOL or WASO is driving a low score, fix that specific problem, and judge success over weeks of data, not one restless night. Combine diary and device readings, and get help if daytime function suffers.
— Sam
Track sleep efficiency without paying a monthly fee for the privilege
Most wearable brands hand you a device, then quietly bill you every month to keep seeing your own sleep data in full. Voltrahealth’s approach is different: sleep tracking, heart health, activity, and recovery data come with lifetime free app access built into the one-off purchase, so a 4 to 6 week efficiency tracking plan doesn’t rack up ongoing costs while you wait for trends to show.
If you’re starting with the basics, VOLTRA AIR at £99.99 covers sleep, heart health, and activity tracking for a straightforward first attempt at building a diary-plus-device baseline. For anyone who wants deeper recovery and stress metrics alongside sleep staging, understanding how toddler sleep needs change can provide useful context for family sleep patterns, while VOLTRA PRO at £129.99 adds sleep tracking without introducing a subscription at any point. Either way, the practical move is the same one outlined above: two weeks of baseline data, then one behavioural change at a time, checked against weekly averages rather than single nights. Pick a device, start logging tonight, and give it the full six weeks before judging the trend.
This article is general information, not a substitute for advice from a qualified doctor. Consult a qualified healthcare professional about your own circumstances before acting on anything here.
Sources
- Measuring Sleep Efficiency: What Should the Denominator Be? — David L Reed et al.
- sleep efficiency — Hypersomnia Foundation glossary
FAQ
What is good sleep efficiency?
Sleep efficiency of 85% or higher is generally considered good, with 90% or above viewed as excellent. The exact threshold shifts slightly depending on whether it’s calculated against time in bed or duration of the sleep episode.
Is 7 hours of sleep efficient?
Seven hours of sleep can be highly efficient or quite inefficient, since efficiency measures the percentage of your sleep interval spent asleep, not the total hours.
Is 84% sleep efficiency good?
Given that wearables can differ from polysomnography by an average of 4.7 percentage points, a single reading from a consumer device isn’t cause for concern on its own, look at the multi-week average instead.
Why is my sleep efficiency so low?
Low sleep efficiency almost always comes down to extended sleep onset latency, wake after sleep onset, or both. Common drivers include insomnia, sleep apnoea, alcohol close to bedtime, pain, anxiety, or an irregular sleep schedule, and pinpointing which one applies matters more than the percentage itself.
How accurate are sleep trackers compared with clinical testing?
Consumer trackers are reasonably reliable for overall sleep timing and duration but less accurate for sleep stages and precise wake detection, with pooled data showing meaningful gaps against polysomnography. They’re best used for spotting trends across a device like VOLTRA over several weeks rather than diagnosing a sleep disorder from one night’s reading.
Share:
4 Week Resonance Breathwork for HRV with No Subscription Tracking
4 Maximum Heart Rate Methods and When a Lab Test Is Worth It