
HRV during sleep reflects stage-dependent autonomic balance, rising through deep NREM sleep and dipping during REM, and it is most useful as a multi-night trend against your own baseline rather than a single overnight number. Measurement method matters too: ECG remains the reference standard, while wrist-based PPG wearables are convenient but more prone to artefact. Treated correctly, sleeping HRV is a genuinely useful recovery signal. Treated as a diagnosis, it is not.
TL;DR:
- Overnight HRV varies significantly between sleep stages, rising during deep NREM sleep and declining during REM, making multi-night trend analysis more reliable than single-night numbers.
- ECG offers the most precise HRV data, while wrist-based PPG wearables are convenient but prone to artifacts and less suitable for detailed sleep-stage analysis.
- A typical pattern shows high HRV early in the night during slow-wave sleep, with lower HRV during fragmented or REM-heavy sleep, so a single average can be misleading without context.
- Factors like alcohol, illness, dehydration, intense exercise, stress, and sleep disruptions can lower HRV temporarily, but persistent trends over weeks are more indicative of underlying issues.
- Consistent measurements within a single device and method, combined with baseline tracking and noting relevant lifestyle factors, are key to using HRV for recovery monitoring effectively.
Table of Contents
- Physiology: how NREM and REM change autonomic control and HRV
- How is HRV measured during sleep? ECG, chest straps and wrist PPG compared
- What do typical overnight HRV patterns actually look like?
- What lowers HRV overnight, and how do you account for it?
- What does the research actually support, and where are the gaps?
- How do you build a reliable overnight HRV protocol?
- Why the average HRV score misses the point
- How Voltra devices help you track HRV without a monthly bill
- Selected primary sources and reviews
- Sources
- FAQ
Physiology: how NREM and REM change autonomic control and HRV
Your autonomic nervous system does not sit still overnight. It swings between two states roughly every 90 minutes, and heart rate variability is the clearest external signature of that swing.
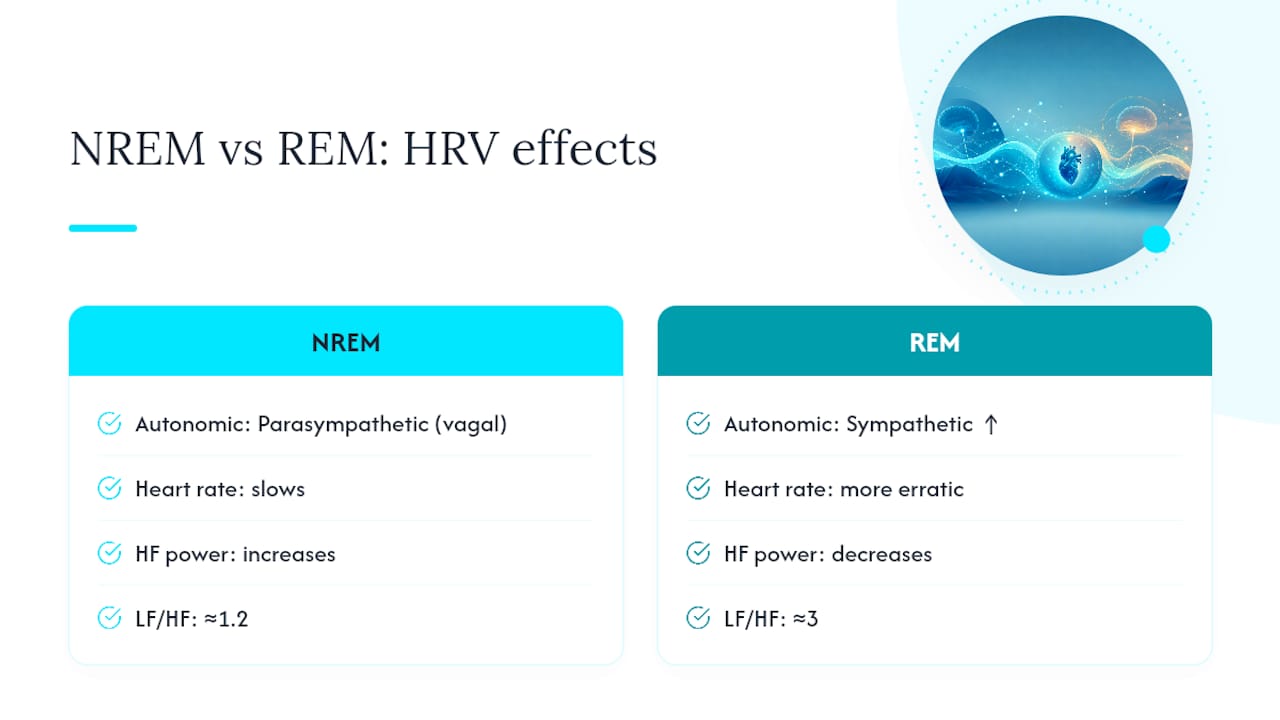
During deep, slow-wave NREM sleep, parasympathetic (vagal) activity dominates. Heart rate slows, breathing becomes regular, and high-frequency (HF) spectral power, the component most closely tied to vagal tone, tends to rise. This is why many people see their highest overnight HRV readings cluster in the first few sleep cycles, when slow-wave sleep is most abundant. Polysomnography-based research confirms this stage-locked pattern, showing that HRV and breathing couple tightly during NREM in ways that simply do not happen during lighter stages.
REM sleep flips the picture. Sympathetic activity increases, heart rate becomes more erratic (closer to a waking pattern), and HF power typically falls relative to NREM. An older but still widely cited study using spectral analysis found the LF/HF ratio dropping from around 4 while awake to roughly 1.22 during NREM, then climbing back to around 3 during REM, a small sample by modern standards, but a pattern that has held up reasonably well in subsequent sleep-stage research.
That LF/HF ratio deserves a word of caution, though. It gets treated in a lot of popular writing as a clean sympathetic-versus-parasympathetic dial. It isn’t. Low-frequency power reflects a mix of influences, including baroreflex activity and slower blood pressure oscillations, not sympathetic tone alone. Respiration rate, the length of the analysis window, and how the signal was preprocessed all shift the ratio independently of what your nervous system is actually doing, a point methodological reviews of HRV analysis make repeatedly. If you are comparing LF/HF across nights, make sure you are comparing like with like: same device, same software, same approach to windowing.
The practical upshot: a night with more slow-wave sleep early on and more REM later will produce a very different HRV shape than a fragmented night with REM scattered throughout. Two nights with an identical overnight average HRV can represent completely different underlying sleep architecture.
How is HRV measured during sleep? ECG, chest straps and wrist PPG compared
Not all HRV readings are created equal, and the gap between methods is bigger than most wearable marketing admits.
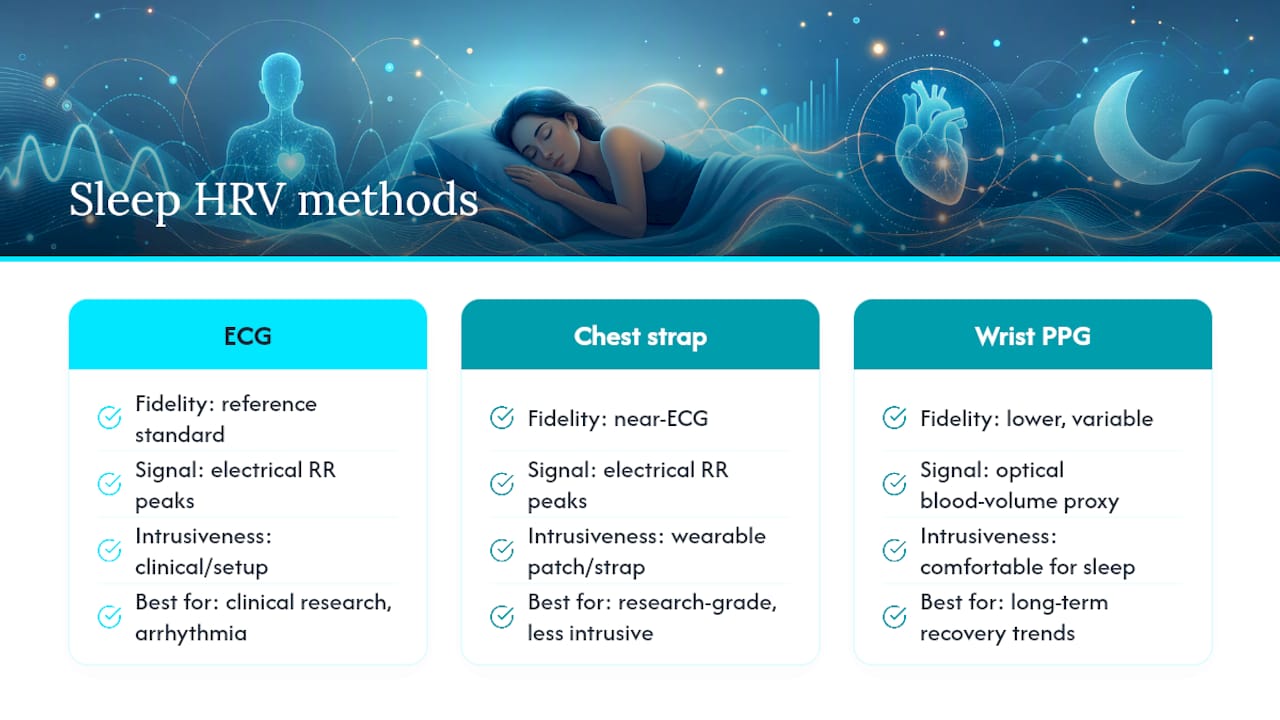
Electrocardiography (ECG) remains the reference standard for RR-interval accuracy. Whether it is a full clinical polysomnography setup or a single-channel research patch, ECG detects the exact moment of each heartbeat’s electrical signal, which is what makes precise interval-to-interval calculations possible. This precision is why ECG-based studies can pick up subtle cardio-respiratory coupling and even flag arrhythmias that other methods would smear into noise.
Chest straps and research-grade patches sit just below clinical ECG in fidelity. They still capture the electrical signal directly rather than inferring it, so RR intervals come through cleanly, and they are considerably less intrusive than a full polysomnography rig.
Wrist-worn PPG (photoplethysmography) wearables work differently. Instead of reading electrical activity, they shine light into the skin and measure blood volume changes as a proxy for each heartbeat. That indirect approach is what makes them small and comfortable enough to sleep in, but it is also where the trouble starts. Motion, loose fit, skin tone, and even ambient temperature can distort the signal, and the algorithm each manufacturer uses to clean up that distortion varies enormously between devices. A 2024 systematic review concluded that ECG delivers the more precise data, while PPG shows real promise for unobtrusive night-long monitoring but still needs further validation before it can be trusted at clinical resolution.
Sampling rate and window length compound this. A device sampling at a low rate, or one that averages over a long window to smooth out noise, will blur exactly the short-term fluctuations that distinguish REM from NREM. That is fine if you only want a single “recovery score” for the morning. It is a problem if you actually want to see sleep-stage-resolved HRV.
So when should you reach for which? If you are a researcher asking a precise physiological question, investigating a suspected arrhythmia, or need clinical-grade data, ECG or a chest-strap patch is the only sensible choice. If you are tracking your own recovery trend over weeks and months, a well-validated PPG wearable worn consistently is entirely adequate, provided you understand its limits and don’t treat single nights as gospel.
What do typical overnight HRV patterns actually look like?
An overnight HRV average is a convenient number and a slightly misleading one. It compresses a night that swung from high-vagal NREM to more sympathetic-leaning REM into a single figure, which can hide exactly the pattern that matters.
Two nights with an identical average can look completely different when you inspect the underlying timeline. A night with a long, unbroken stretch of slow-wave sleep early on will likely show a steep rise in HRV in the first cycle. A fragmented night, interrupted by a partner’s alarm or a bathroom trip, might average out to a similar number while having no clean high-HRV window at all. If your device shows a per-stage or per-hour breakdown rather than just a single overnight figure, use it.
Age, sex, fitness level, and medication all shift the absolute numbers too. Younger, fitter people tend to run higher HRV values; HRV declines gradually with age; certain medications, particularly beta-blockers, alter heart-rate control mechanisms enough to change readings meaningfully. Reviews of HRV in normal and pathological sleep are consistent on this point: there is no single “good” number that applies across people, which is why chasing a benchmark seen in an app or forum is close to pointless. Your own multi-night baseline is the only number worth anchoring to.
That distinction between a single dip and a real trend matters practically. One low-HRV night after a late dinner and a glass of wine is background noise, not a warning sign. A steady, multi-week downward drift against your personal baseline is a different matter, and worth paying attention to, especially alongside symptoms.
The workable rule of thumb: compare within your own device and method over time, glance at the night’s timeline rather than just the summary score, and note anything unusual (illness, travel, alcohol, a hard training session) so a single odd night doesn’t get mistaken for a pattern.
What lowers HRV overnight, and how do you account for it?
Overnight HRV is sensitive to almost everything you did in the 24 hours before bed, which is exactly why context matters more than the raw number.
Some causes are transient and resolve on their own within a night or two:
- Alcohol, even one or two drinks, suppresses vagal activity and reliably lowers HRV the same night.
- Acute infection or the early stages of illness, before you feel unwell, often shows up as a dip.
- Dehydration reduces blood volume and stresses cardiovascular regulation.
- Late, strenuous exercise keeps sympathetic activity elevated well into the night.
- Jet lag and circadian disruption throw off the timing of your usual autonomic pattern.
- A fragmented night with frequent awakenings prevents the deep-NREM HRV rise from ever properly establishing itself.
Others point to something more chronic and worth watching:
- Untreated sleep-disordered breathing, including obstructive sleep apnoea, produces repeated arousal-linked HRV disruption night after night.
- Ongoing psychological stress keeps sympathetic tone elevated even during sleep.
- Certain medications alter heart-rate control directly.
- Overtraining, where recovery consistently lags behind training load, tends to show up as a persistently lower baseline rather than one bad night.
Evidence on sympathovagal imbalance during sleep is clear that a lower-than-usual reading can accompany real physiological strain, illness, stress, alcohol, heavy training, or breathing disruption, but is equally clear that HRV alone should never be used to diagnose arrhythmia, sleep apnoea, or cardiovascular disease. It is a signal to investigate further, not a verdict.
Menstrual-cycle phase and training load are worth tagging specifically if you track over months. Luteal-phase HRV commonly runs lower than follicular-phase HRV in many people, and a heavy training block will suppress readings in ways that look alarming until you factor in the load behind them. Tag your nights (alcohol, illness, hard session, travel, cycle phase) as you go, and a persistent drop stops looking mysterious.
The threshold for seeking clinical evaluation: a genuinely sustained downward trend against your own baseline, lasting weeks rather than days, especially alongside symptoms like daytime sleepiness, palpitations, or chest discomfort.
What does the research actually support, and where are the gaps?
Nocturnal HRV sits in an interesting spot: well-established physiologically, but still catching up in terms of clinical validation, particularly for consumer-grade sensors.
The physiological groundwork is solid. Polysomnography studies have repeatedly shown stage-specific HRV modulation, and this coupling between cardiac rhythm and breathing during sleep is well enough characterised that ECG-based nocturnal monitoring can flag arrhythmias and support sleep-disorder detection when paired with respiratory measures. Clinical studies going back decades have identified stage-specific autonomic signals, including nocturnal vagal suppression after cardiac events, that appear to carry prognostic information about future risk. That said, many of these studies work with small samples and inconsistent methodology, so treat any specific numeric threshold with appropriate scepticism rather than as an established clinical cut-off.
The gaps sit mainly around consumer technology. A systematic review of remote sympathovagal monitoring found HRV, particularly combined with blood pressure, to be a promising remote metric for mapping nocturnal autonomic function, but flagged that PPG-based sensing still needs considerably more validation against ECG before it earns clinical-grade trust. There is no universal “normal” HRV cut-off that applies across ages, sexes, and measurement devices, sensor variability between manufacturers remains substantial, and most validation work still happens in relatively controlled lab settings rather than in people’s actual bedrooms over months.
Where the field seems to be heading is multimodal: combining HRV with blood pressure, oxygen saturation, and respiratory data rather than leaning on any single metric. That approach gives a fuller autonomic and cardiovascular picture than HRV alone ever could, which is a sensible caution for both researchers designing studies and individuals reading their own morning scores.
How do you build a reliable overnight HRV protocol?
Getting comparable, trustworthy HRV data night after night comes down to consistency, not sophistication. Here is a straightforward sequence to follow.
- Pick one device and one metric, and stay with them. Switching between a wrist wearable one week and a chest strap the next introduces algorithm differences that will masquerade as real physiological change. If your goal is a research-grade question, favour a higher-sampling ECG-based device from the start.
- Build a baseline over several consecutive nights before drawing any conclusions. A single reading tells you almost nothing. Tag each night with anything relevant, alcohol, illness, a heavy training session, travel, or menstrual phase, so you can explain outliers later rather than guessing.
- Look at the night’s timeline, not just the morning summary. Exclude nights with obvious sensor noise (a loose strap, a device that fell off) and prefer a rolling median across a week or two over any single extreme night, high or low.
Pro Tip: If you notice a genuinely persistent downward trend in your baseline, lasting more than a couple of weeks, alongside symptoms like unusual daytime sleepiness, palpitations, or chest discomfort, that combination is worth raising with a GP rather than solving with another data point.
Small, deliberate changes tend to move the number more reliably than obsessing over nightly fluctuations. Reducing alcohol intake and practising slow, paced breathing before bed are two of the better-supported levers, and Voltrahealth’s guidance on cutting alcohol and breathing exercises walks through a practical eight to twelve week approach if you want a structured starting point.
Why the average HRV score misses the point
Most people chase a single number when what actually matters is the shape of the trend behind it. A reading of 45 on a Tuesday means almost nothing in isolation; that same reading, sitting three points below your usual four-week rolling average and coinciding with a run of late nights, means quite a lot.
The bigger issue is how much faith gets placed in cross-device comparison. Someone sees a friend’s app reporting 70 and assumes their own 50 signals a problem, when the two devices are simply calculating things differently. Consistency within one device and one method beats precision chased across several. That is a duller message than most wearable marketing wants to sell, but it is the one backed by the evidence.
Wearables, used sensibly, are a genuinely useful piece of a broader recovery picture, not a verdict machine.
— Sam
How Voltra devices help you track HRV without a monthly bill
Most HRV tracking advice above only works if you can actually collect consistent, multi-night data without switching devices or wrestling with a subscription wall halfway through the process. That is the specific gap Voltrahealth’s hardware is built to close: continuous overnight sleep and HRV tracking with lifetime access to the companion app, at no recurring cost.

Each device in the range, VOLTRA AIR, VOLTRA PRO, and VOLTRA CORE, tracks sleep stages, heart health, and daily activity alongside HRV, so you can build the kind of rolling, tagged baseline this article recommends rather than reacting to single-night swings. Current prices for these devices are available on the pricing page of the official website. If you want a practical starting point for improving your own readings once you’re tracking, Voltrahealth’s four-week resonance breathwork programme pairs well with the baseline-building approach outlined above. Pick the device that matches how deep you want to go, and start building your own multi-night baseline tonight.
Selected primary sources and reviews
- Heart rate variability in normal and pathological sleep: foundational review on HRV and sleep-stage physiology.
- Remote monitoring of sympathovagal imbalance during sleep: 2024 systematic review on ECG versus PPG accuracy.
- Modulations of heart rate, ECG, and cardio-respiratory coupling in polysomnography: stage-resolved HRV and arrhythmia detection.
- Heart rate variability during specific sleep stages: spectral-analysis evidence on LF/HF shifts across stages.
This article is general information, not a substitute for advice from a qualified doctor. Consult a qualified healthcare professional about your own circumstances before acting on anything here.
Sources
- Heart rate variability in normal and pathological sleep
- Remote monitoring of sympathovagal imbalance during sleep and its implications in cardiovascular risk assessment: a systematic review
- Modulations of heart rate, ECG, and cardio-respiratory coupling observed in polysomnography
- Heart rate variability during specific sleep stages (Vanoli et al.)
FAQ
Is it normal to have a slower heart rate only at night?
Yes, nocturnal bradycardia (a slower resting heart rate during sleep) is common and usually reflects healthy parasympathetic dominance during NREM sleep rather than a problem. It becomes worth checking with a GP only if it is accompanied by symptoms like dizziness, fatigue, or fainting, or if daytime heart rate is also unusually low.
Does dehydration affect HRV?
Yes, dehydration reduces blood volume and places extra strain on cardiovascular regulation, which typically lowers HRV that night. It is one of the more common transient causes of a lower-than-usual overnight reading and usually resolves once fluid intake returns to normal.
Should I exercise if my HRV is low?
A single low reading after one rough night is not a strong reason to skip training, but a sustained downward trend against your personal baseline is worth respecting with lighter training or extra recovery. Evidence on autonomic strain during sleep links persistently suppressed HRV to overtraining and unresolved fatigue, so treat a real trend, not a single night, as the signal to ease off.
What counts as low HRV?
There is no universal cut-off for low HRV; it depends heavily on age, sex, fitness, medication, and the measurement method used, so the research consistently favours comparing against your own baseline rather than a fixed number. A reading is more meaningfully “low” when it sits well below your own multi-night average than when compared to any generic benchmark.
Are wrist wearables accurate enough for tracking sleep HRV?
Wrist-based PPG wearables are accurate enough for spotting personal trends over weeks and months, though they are more sensitive to motion and fit than ECG-based devices. For research-grade precision or clinical questions, ECG or a chest-strap patch remains the more reliable choice, while a consistent wearable is entirely adequate for longitudinal recovery tracking.
Share:
Steps within 10% but Sleep Stages 50–65%: Fitness Tracker Accuracy
Alcohol and Sleep Data: Wearables Show 2–3 BPM Rise per Drink